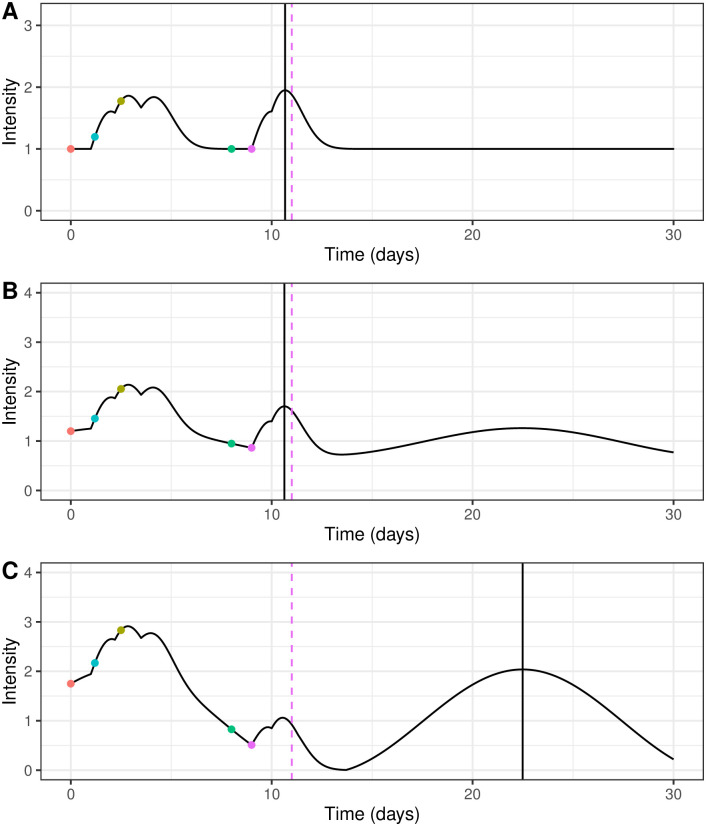
Fig 1. Illustrative plot of intensity function for events occurring at times 0, 1.2, 2.5, 8 and 9 with kernel parameters α = 1.0 and δ = 1.0, a 1 day delay and a time varying μ.
The coloured dots refer to different events or infections and the dashed pink line indicate the time of the theoretical maximum value of a single Rayleigh kernel at the last event time. The solid black line indicates the time of the maximum value of the kernel after the last event. Fig 1A shows a constant μ and Fig 1B and 1C show sinusoidal μ with a linear decrease of different magnitudes. The parameters for Eq (6) in each case are as follows: A—A = 1; B—A = 1, B = −0.001, M = 0.2, N = 0.2 and p = 20; C—A = 1, B = −0.001, M = 0.75, N = 0.75 and p = 20. These parameters are only illustrative and do not reflect parameters we would expect real in malaria models.

