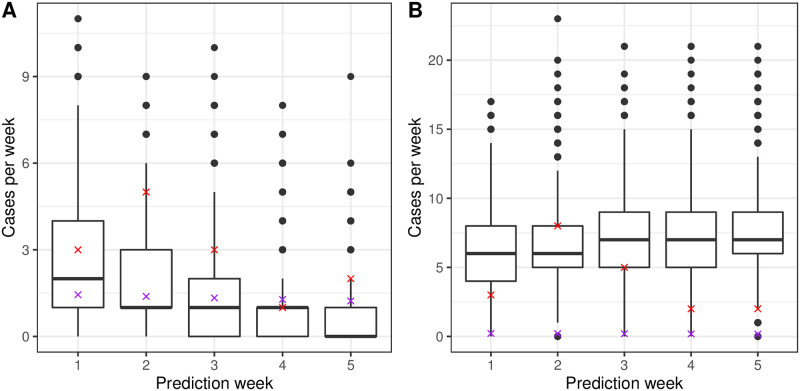
Fig 6. Predicted total weekly cases of malaria.
Fig 6A shows weekly predicted cases of malaria for China and Fig 6B for Eswatini respectively. The red crosses show real number of cases each week, the purple crosses show the predictions from the growth model and the box and whisker plot show predictions from the 10,000 simulations. The box shows the interquartile range and the whiskers show 1.5 times the interquartile range above and below the 25th and 75th percentile.

