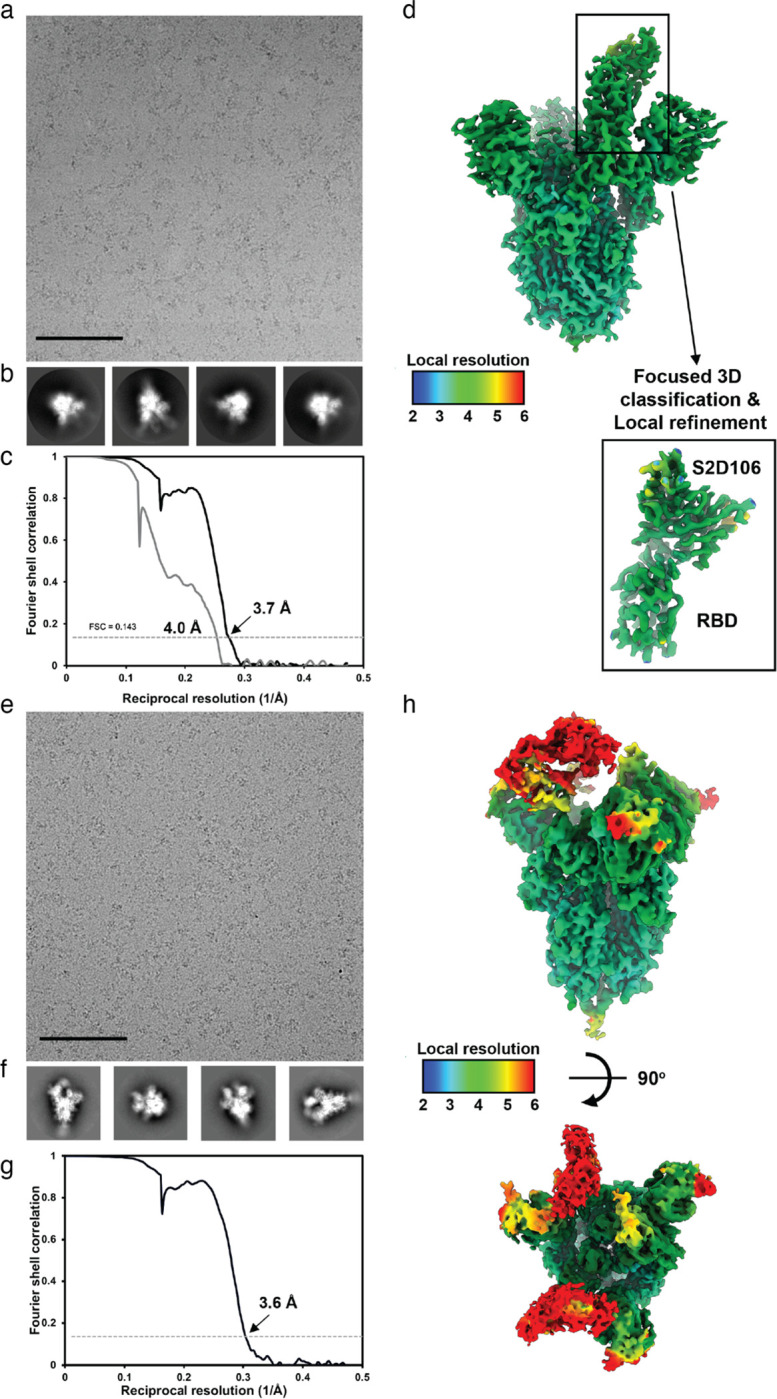
Extended Data Fig. 7. Data collection and processing of the S/S2D106 and S/S2H97 complex cryoEM datasets.

a,b, Representative electron micrograph and 2D class averages of SARS-CoV-2 S in complex with the S2D106 Fab embedded in vitreous ice. Scale bar: 400 Å. c, Gold-standard Fourier shell correlation curves for the S2D106-bound SARS-CoV-2 S trimer (black line) and locally refined RBD/S2D106 variable domains (gray line). The 0.143 cutoff is indicated by a horizontal dashed line. d, Local resolution map calculated using cryoSPARC for the whole reconstruction and the locally refined RBD/S2D106 variable domain region. e,f, Representative electron micrograph and 2D class averages of SARS-CoV-2 S in complex with the S2H97 Fab embedded in vitreous ice. Scale bar: 400 Å. g, Gold-standard Fourier shell correlation curve for the S2H97-bound SARS-CoV-2 S trimer reconstruction. The 0.143 cutoff is indicated by a horizontal dashed line. h, Local resolution map calculated using cryoSPARC for the whole reconstruction with two orthogonal orientations.
