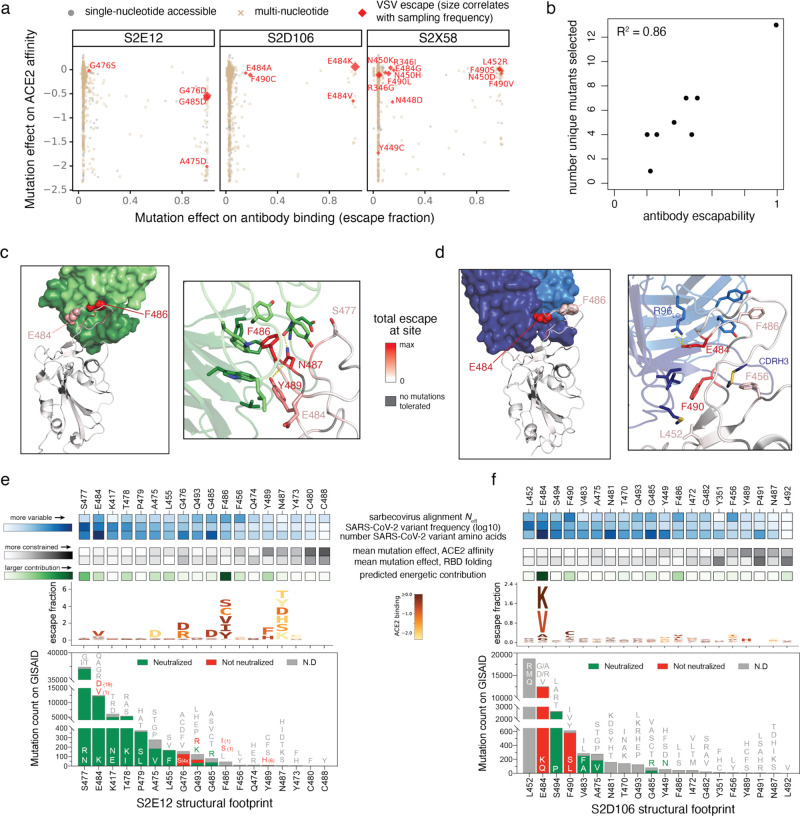
Fig. 3. Structural basis for variation in antibody escapability.
a, Escape mutations identified in spike-expressing VSV passaged in the presence of monoclonal antibody, illustrated with respect to their effects on antibody (x-axis) and ACE2 (y-axis) binding. Amino acid mutations are coded by whether they are accessible via single-nucleotide mutation from the wildtype spike gene sequence used in the VSV selections (Wuhan-Hu-1+D614G). See additional selections, Extended Data Fig. 6b. b, Correlation between the number of unique mutations selected across viral escape selection experiments and antibody escapability as tabulated in Fig. 1b,c, plus S2X259 (see accompanying paper, Tortorici et al.). c,d, Structures of S2E12 (c) and S2D106 (d) bound to RBD. RBD sites are colored by escape (scale bar, center). Antibody heavy chains colored dark green (S2E12) or blue (S2D106), with light chains in lighter shades. Righthand images show zoomed-in context of key structural features impacting antibody escapability. e,f, Integrative genetic and functional features of the structural epitopes of S2E12 (e) and S2D106 (f). Sites within the structural footprint of each antibody (5 Å cutoff) are ordered by the frequency of observed mutants among SARS-CoV-2 sequences present on GISAID. Heatmaps illustrate evolutionary variability (blue), functional constraint from prior deep mutational scanning measurements (gray) and predicted energetic contribution of a residue derived from the structures (green). Logoplots illustrate escape from antibody binding as in Fig. 1c, but only showing amino acid mutations accessible via single-nucleotide mutation from Wuhan-Hu-1 for comparison with (a). Barplots illustrate the frequency of SARS-CoV-2 mutants at each position and their validated effects on antibody neutralization measured in spike-pseudotyped VSV particles with Vero E6 cells (red, >3-fold increase in IC50 due to mutation).

