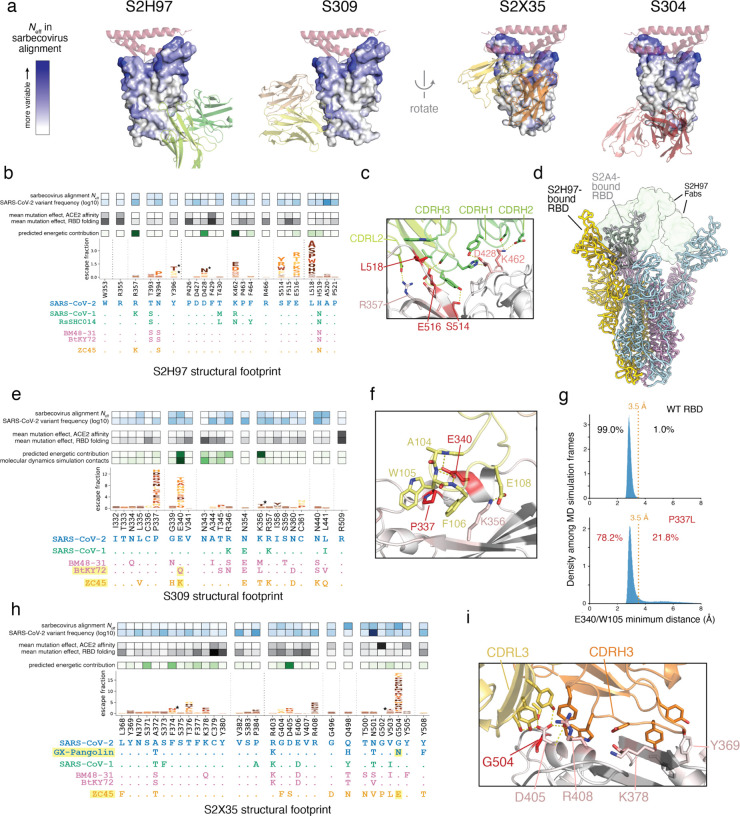
Fig. 4. Structural basis for broad sarbecovirus binding.
a, Overview of the surfaces targeted by broadly binding RBD antibodies. RBD surface is colored by site variability in the sarbecovirus alignment (effective number of amino acids, scale bar at left). ACE2 (key motifs) shown in transparent cartoon. Antibody variable domains shown as cartoon, with darker shade indicating the heavy chain. b, Integrative genetic and structural features of the S2H97 structural epitope (5 Å cutoff). Heatmap details and scale bars as in Fig. 3e,f. Logoplots are colored by mutation effects on folded RBD expression (see scale bar, Fig. 1b). Asterisks in logoplot indicate escape mutations that introduce N-linked glycosylation motifs (NxS/T). Below the logoplot is a selection of aligned sarbecovirus RBDs (sequenced colored by clade as in Fig. 1d, Extended Data Fig. 5a). c, Zoomed in view of the S2H97/RBD interface, with important contact and escape residues labeled. d, CryoEM structure of S2H97-bound SARS-CoV-2 S. Spike protomers are shown in yellow, blue, and pink, and S2H97 Fabs in transparent green surface. S2A4-bound spike protomer from PDB 7JVC17 is shown in gray and aligned to the yellow subunit, indicating the additional extent of RBD opening necessary to access the S2H97 epitope compared to a class II antibody. e, Integrative features of the S309 structural epitope, details as in (b). An additional row in the heatmap overlay reflects the proportion of all close S309/RBD contacts (<3.5 Å) made by each residue during molecular dynamics simulation. Highlighted sarbecoviruses identify those that escape S309 binding, and highlighted mutation in the alignment is the likely contributor according to our escape map. f, Zoomed in view of the S309/RBD interface, with important contact and escape residues labeled. g, Molecular dynamics simulations of the S309/RBD structure. Histograms show the distribution of minimum distance between E340RBD and W105HC heavy atoms across 1-ns frames during the simulation of the unmutated (top, 42-μs simulation) and P337L mutated (bottom, 91-μs simulation) RBD bound to S309. Orange line reflects the 3.5 Å distance cutoff used to define close contact. Percentage of frames in which E340 and W105 are or are not in close contact is labeled. See Extended Data Fig. 8c for the occupancy of other S309:RBD contacts across the simulations. h, Integrative features of the S2X35 structural epitope, details as in (b). i, Zoomed in view of the S2X35/RBD interface, with important contact and escape residues labeled.

