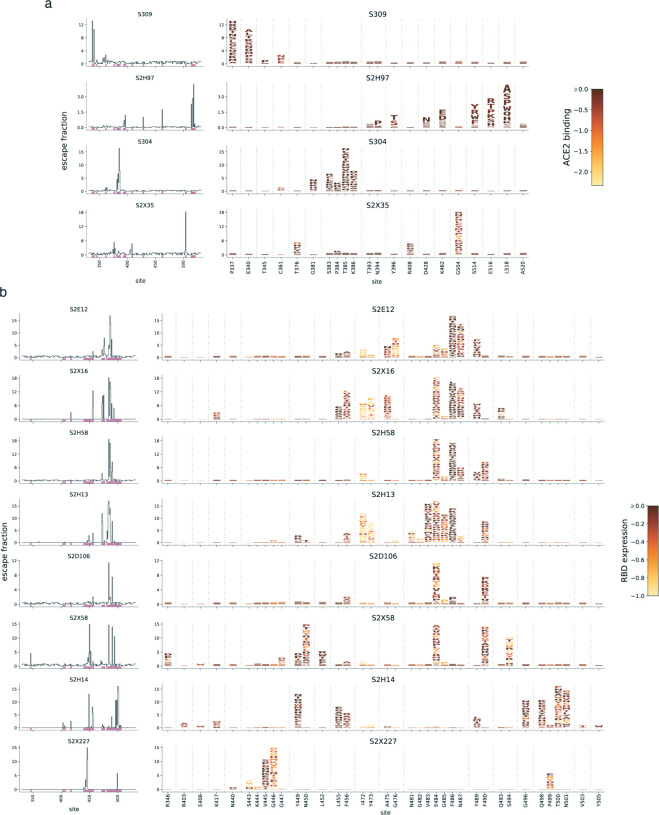
Extended Data Figure 3. Expanded antibody escape profiles.
a,b, Complete maps of escape, with mutations colored by their effects on the opposite RBD property illustrated in Fig. 1b,c. Line plots to the left of each logoplot illustrate the total escape at each RBD site. Pink bars illustrate sites shown in logoplots at right. Sites in logoplots are more expansive than Fig. 1b,c, as they reflect a more sensitive threshold of site-wise escape for logoplot visualization due to space constraints in Fig. 1b,c.

