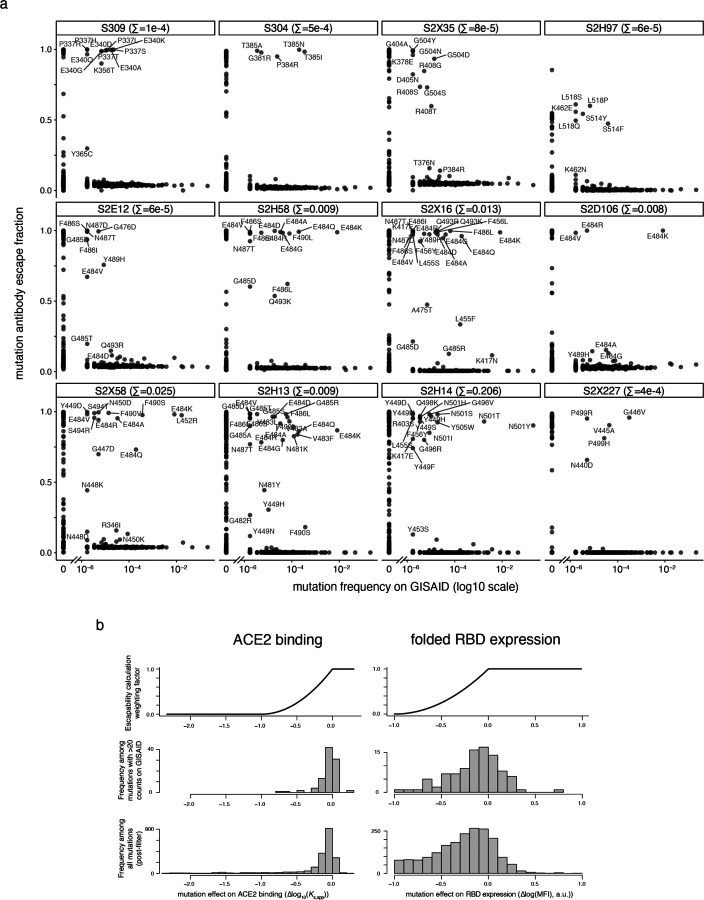
Extended Data Fig. 4. Antibody escapability in natural SARS-CoV-2 mutants and from deep mutational scanning measurements.
a, For each antibody, scatterplots illustrate the degree to which a mutation escapes antibody binding (escape fraction, y-axis) versus its frequency among 582,276 high-quality human-derived SARS-CoV-2 sequences present on GISAID as of March 4, 2021. Large escape mutations (>5x global median escape fraction) for each antibody with non-zero mutant frequencies are labeled. The sum in each plot label gives the sum of mutant frequencies for all labeled mutations, corresponding to the natural SARS-CoV-2 mutant escape frequency for antibodies shown in Figs. 2g,j. b, To calculate antibody escapability (Fig. 1b,c), mutation escape fractions were weighted by their deleterious consequences for ACE2 binding or RBD expression. Top plots show the weighting factor (y-axis) for mutation effects on ACE2 binding (left) and RBD expression (right). This scaling weight factor was multiplied by the mutation escape fraction in the summation to calculate antibody escapability, as described in the Methods. For contextualizing this weighting penalization, histograms show the distribution of mutation effects on ACE2 binding (left) and RBD expression (right) for all mutations that pass our computational filtering steps (bottom), and mutations that are found with at least 20 sequence counts on GISAID (middle).

