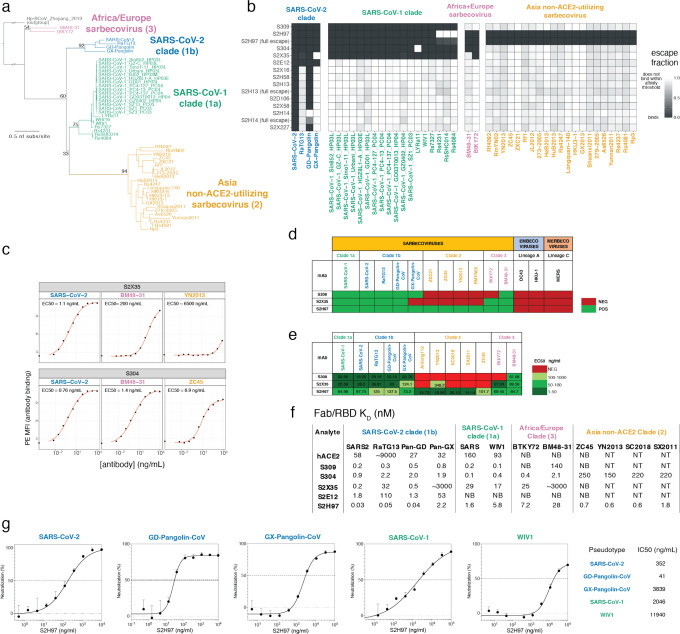
Extended Data Fig. 5. Breadth of antibody binding across sarbecoviruses.
a, Phylogenetic relationship of sarbecovirus RBDs inferred from aligned RBD nucleotide sequences, with the four clades of sarbecovirus RBD labeled in separate colors used throughout text. Node support values are rapid bootstrap support values, illustrating substantial ambiguity in the exact relationship between the three clades of sarbecovirus in Asia. b, A yeast-display library containing all sarbecovirus RBDs was assayed for antibody escape analogous to SARS-CoV-2 mutant selections, as shown in Extended Data Fig. 2. Heatmaps show escape (white) versus binding (black) within the affinity threshold of the FACS escape bins (Extended Data Fig. 2b). For S2H97, S2H13, and S2H14, we repeated selections with a more stringent “full escape” bin (0 ng/mL WT control, Extended Data Fig. 2b,c), enabling differentiation of RBDs with intermediate binding (e.g., S2H97/RsSHC014) versus complete loss of binding. c-e, Because the high-throughput assay in (b) yields binary measures of binding versus escape at a set threshold determined by FACS gate selection, we performed follow-up quantitative binding assays for select antibody/RBD combinations including flow cytometry detection of antibody binding to isogenic yeast-displayed RBD variants (c), flow cytometry detection of antibody binding to mammalian-surface displayed spikes (d), and ELISA using purified RBD proteins (e). These experiments validate the affinity thresholds of “escape” illustrated in (b) while adding additional context to interactions that are still present but with reduced binding strength. f, Binding of cross-reactive antibodies (Fab) and human ACE2 to select sarbecovirus RBDs was determined via SPR. NB, no binding; NT, not tested. g, S2H97 neutralization of VSV pseudotyped with select sarbecovirus spikes, with entry measured in VeroE6 (SARS-CoV-2, GD-Pangolin-CoV, and SARS-CoV-1) or ACE2-transduced BHK-21 cells (GX-Pangolin-CoV and WIV1). Curves are representative of at least two independent experiments. Error bars represent standard deviation from three technical replicates from one representative experiment.

