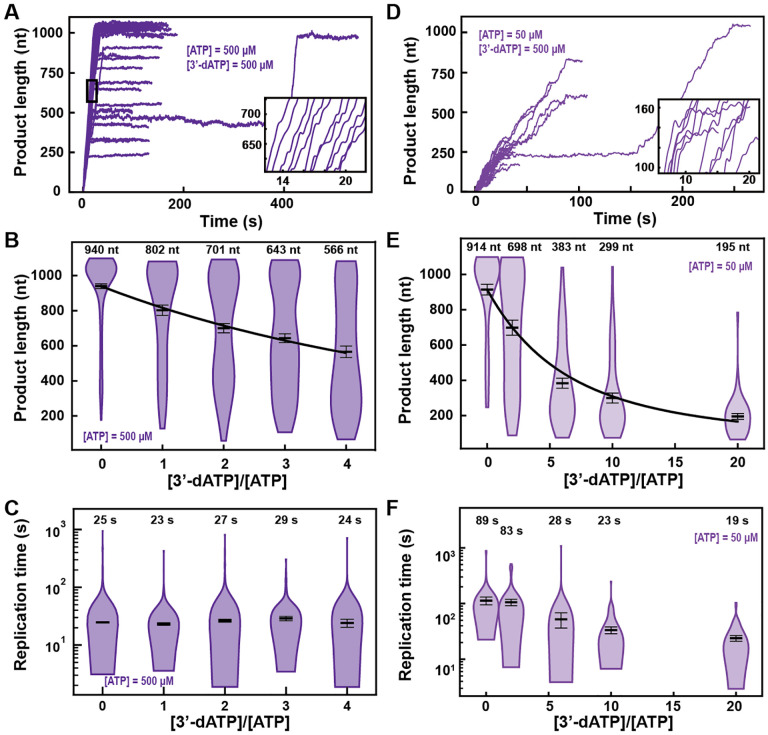
Fig. 2. 3’-dATP is an effective chain terminator for the SARS-CoV-2 polymerase.
(A) SARS-CoV-2 replication traces for 500 μM NTPs and 500 μM 3’-dATP; and (D), for 50 μM ATP, 500 μM all other NTPs and 500 μM 3’-dATP. (B, E) SARS-CoV-2 polymerase product length for the 1043 nt long template using the indicated concentration of ATP, 500 μM of other NTPs, as a function of [3’-dATP]/[ATP]. The mean values are indicated above the violin plots, and represented by horizontal black thick lines flanked by one standard deviation error bars extracted from 1000 bootstraps. (C, F) Replication time for the reaction conditions described in (B, E). The medians are indicated above the violin plots, and represented by horizontal black thick lines flanked by one standard deviation error bars extracted from 1000 bootstraps. In (B, E), the solid lines are the fits of the terminator effective incorporation rate (Supplementary Materials). In (A, D), the insets are zoom-in of the replication traces captured in the black square.

