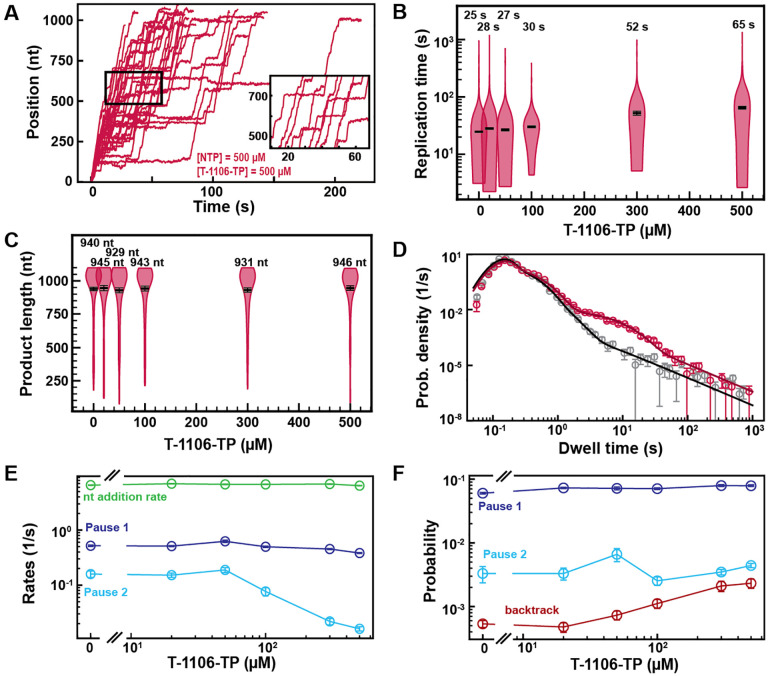
Fig. 4. T-1106-TP incorporation induces pauses of intermediate duration and backtrack.
(A) SARS-CoV-2 polymerase activity traces in the presence of 500 μM NTPs, in the presence of 500 μM T-1106-TP. The inset is a zoom-in of the polymerase activity traces captured in the black square. (B) SARS-CoV-2 replication time for the 1043 nt long template using 500 μM of all NTPs, and the indicated concentration of T-1106-TP. The median values are indicated above the violin plots, and represented by horizontal black thick lines flanked by one standard deviation error bars extracted from 1000 bootstraps. (C) SARS-CoV-2 polymerase product length using 500 μM NTPs and the indicated concentration of T-1106-TP. The mean values are indicated above the violin plots, and represented by horizontal black thick lines flanked by one standard deviation error bars extracted from 1000 bootstraps. (D) Dwell time distributions of SARS-CoV-2 polymerase activity traces for 500 μM NTP either without (gray) or with 500 μM (red) T-1106-TP. The corresponding solid lines are the fit to the pause-stochastic model. (E) Nucleotide addition rate (green), Pause 1 (dark blue) and Pause 2 (cyan) exit rates for [NTPs] = 500 μM and several T-1106-TP concentrations. (F) Probabilities to enter Pause 1 (dark blue), Pause 2 (cyan) and the backtrack (red) states for the conditions described in (E). The error bars denote one standard deviation from 1000 bootstraps in (D). Error bars in (E, F) are one standard deviation extracted from 100 bootstrap procedures.

