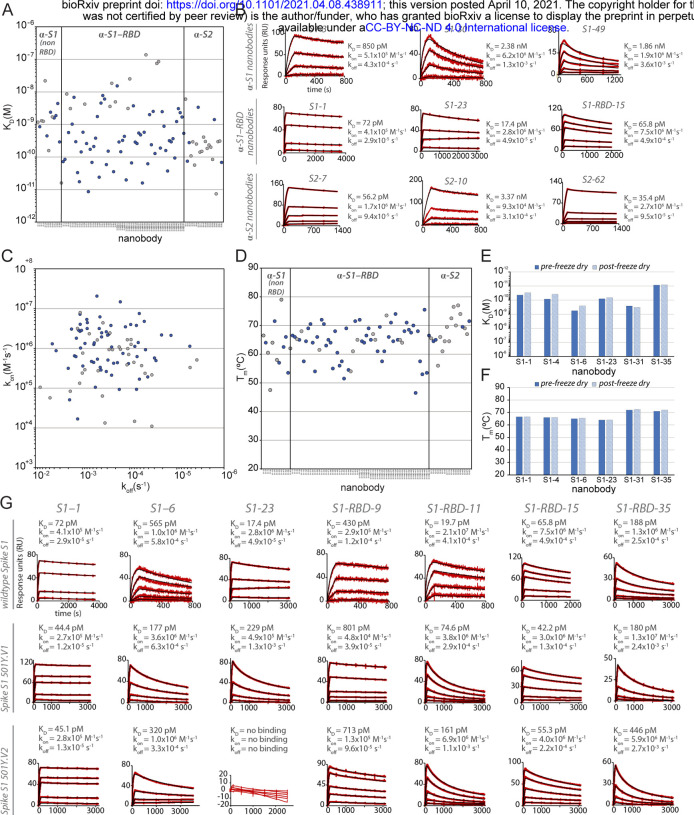
Figure 2. Biophysical characterization of anti-SARS-CoV-2 Spike nanobodies.
(A) Each nanobody plotted against their affinity (KD) for their antigen separated into three groups based on their binding region on SARS-CoV-2 Spike protein. The data points highlighted in blue correspond to nanobodies that neutralize. The majority of nanobodies have high affinity for their antigen with KDs below 1 nm. 10 nanobodies are not included in this plot as they were unable to be analyzed successfully using SPR. (B) SPR sensorgrams for each of the three targets on SARS-CoV-2 Spike protein of our nanobody repertoire, showing three representatives for each binding region. (C) The association rate of each nanobody (kon) versus the corresponding dissociation rate (koff). The majority of our nanobodies have fast association rates (≥10+5 M−1s−1), with many surpassing the kon of high performing monoclonal antibodies and nanobodies with a kon > M−1s−1. (D) Each nanobody plotted against their Tm as measured by DSF, revealing all but two nanobodies fall within the optimal Tm range (between 50°C and 80°C), where the bulk of our nanobodies have a Tm ≥60°C. No data could be collected for two nanobodies and 10 nanobodies exhibited two dominant peaks in the thermal shift assay and were not included in this plot (a full summary of this data can be seen in Suppl. Tables 1 and 2). The KD (E) and TM (F) of six nanobodies was assessed pre- and post- freeze-drying, revealing no significant change in affinity or Tm after freeze-drying. (G) SPR sensorgrams comparing the kinetic and affinity analysis of seven nanobodies against wildtype Spike S1 (Wuhan str.), Spike 20I/S1 501Y.V1 (United Kingdom variant) and 20H/Spike S1 501Y.V2 (Sth. African variant).

