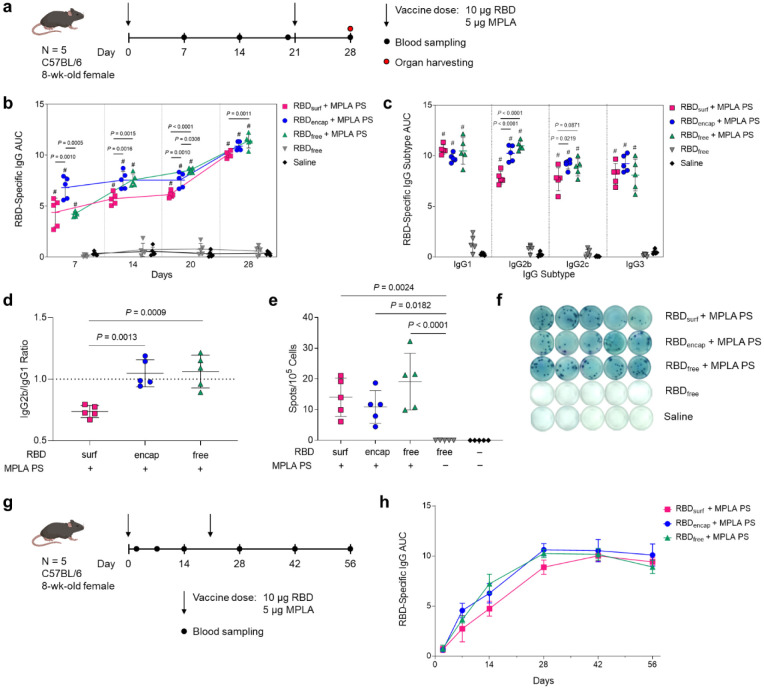
Figure 2 |. High levels of RBD-specific IgG antibodies are produced upon PS vaccination.
a, Vaccination schedule consisting of a priming dose followed by a booster 3 weeks later. b, Total RBD-specific IgG antibodies over time reported as the area under the log-transformed curve (AUC) of absorbance vs. dilution. c, Comparison of RBD-specific IgG isotypes (IgG1, IgG2b, IgG2c, IgG3) on day 28. d, Ratio of AUCs of IgG2b:IgG1 isotypes. e, Quantification of RBD-specific IgG+ antibody secreting cells by ELISpot of splenocytes (Dunn’s post-test compared to unadjuvanted RBDfree). f, Representative ELISpot wells from (e). Data plotted as mean ± SD and represent 1 of 2 experiments with n = 5 mice each. Symbols represent individual mice. g, Vaccine and blood sampling schedule of long-term kinetics study. h, Total RBD-specific IgG antibodies over time for the vaccination schedule in (g). Data represent mean ± SD for n = 5 mice. Comparisons were made using one-way ANOVA with Tukey’s post-test unless stated otherwise. # P < 0.0001 compared to unadjuvanted RBDfree.

