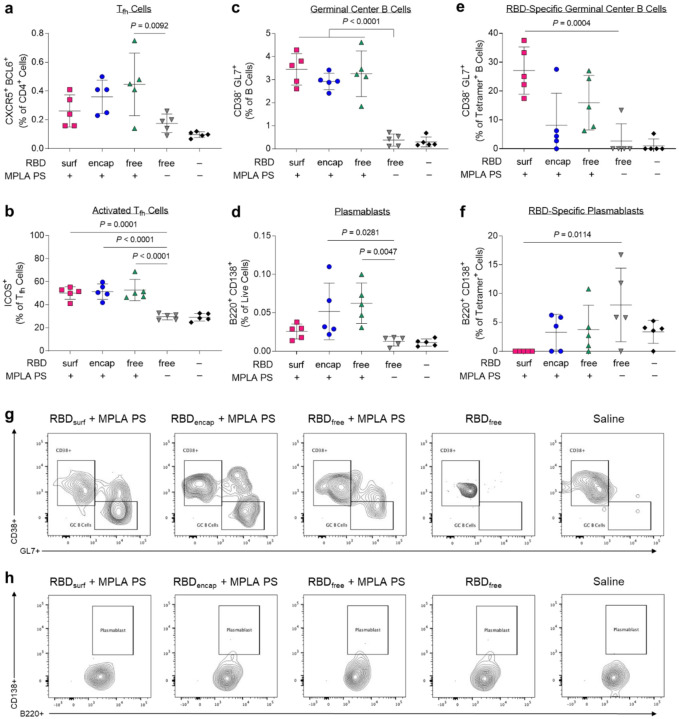
Figure 4 |. CD4+ T follicular helper cell (Tfh) and B cells are activated by PS vaccine 1 week post-boost in the injection site-draining lymph nodes (dLN).
a, Tfh cells (CXCR5+ BCL6+) of vaccinated mice quantified via flow cytometry as a percent of live CD4+ T cells. b, Highly activated ICOS+ Tfh cells quantified as percent of Tfh cells. c, Germinal center B cells (CD38− GL7+) quantified as a percentage of total B cells (B220+ CD19+). d, Plasmablasts (B220+ CD138+) quantified as a percentage of total dLN cells. e, Germinal center B cells quantified as a percentage of RBD-specific B cells. f, Plasmablasts quantified as a percentage of RBD-specific dLN cells. g-h, Concatenated flow cytometry contour plots for n = 5 mice/group showing RBD-specific GC B cells (g) or plasmablasts (h). Data plotted as mean ± SD and represent 1 of 2 experiments with n = 5 mice each. Symbols represent individual mice. Comparisons to unadjuvanted RBDfree were made using one-way ANOVA with Dunn’s post-test.

