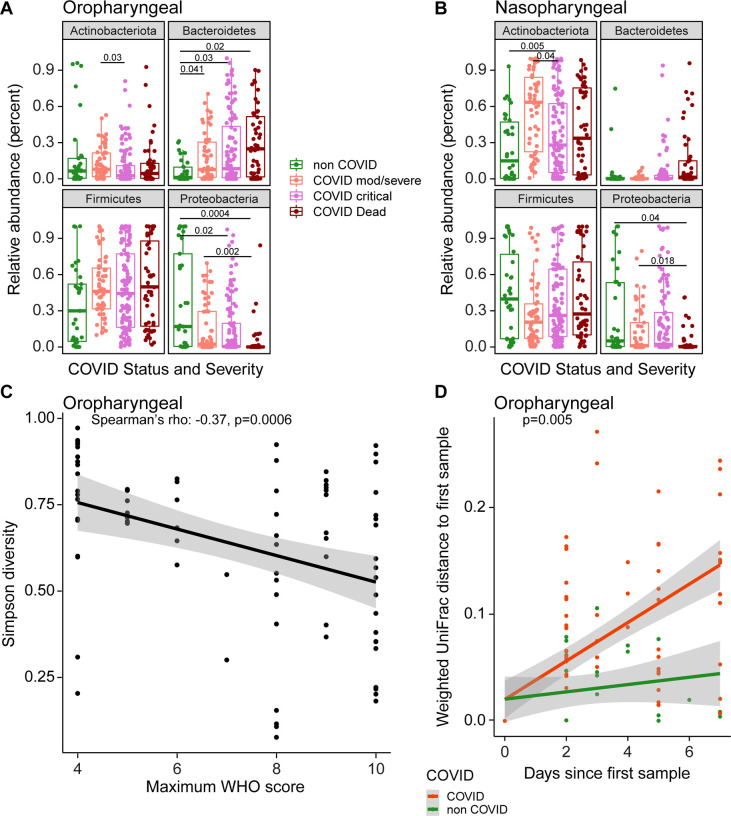
Figure 2. Signatures of disease severity in airway bacterial populations.
A, B. Relative abundances of bacterial phyla, by patient disease status categories. All samples are shown; P values were generated using random subsampling for each subject and indicate Wilcoxon pairwise comparisons. C. Maximum WHO score reached by each patient (x-axis) versus Simpson Diversity Index in the first oropharyngeal sample obtained for each subject (y-axis). The grey shading shows the 95% confidence interval. D. Divergence in oral bacterial communities over time, comparing COVID-19 (red) and non-COVID (green) samples. The x-axis shows the time since the first sample, the y-axis shows the weighted UniFrac distance to the first sample. The grey shading shows the 95% confidence interval.

