Figure 4.

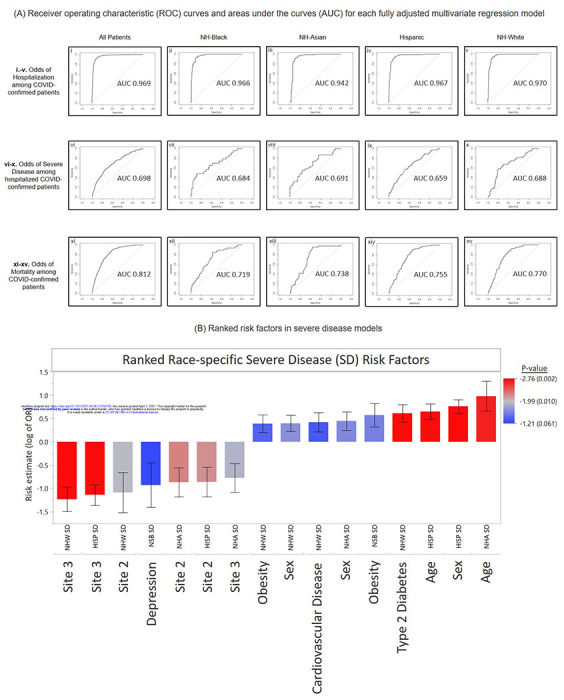
A. Performance of Risk Models and Ranked Risk Factors. A. Receiver operating characteristic (ROC) curves and areas under the curves (AUC) for each fully adjusted multivariate regression model: (i.-v) odds of hospitalization among confirmed COVID-19 patients overall and by race groups; (vi-x) odds of severe disease among hospitalized confirmed COVID-19 patients overall and by race groups; (xi-xv) odds of mortality among confirmed COVID-19 patients overall and by race groups. NH = Non-Hispanic.
B. Ranked risk factors in severe disease models. Combined significant severe disease risk factors identified in the all-inclusive models and stratified within race groups. Bar graphs represent estimated effect measurements for indicated subset and factors, with Standard Error bars. P-values are color coded with increasing significance, red=most significant, blue=least significant.
