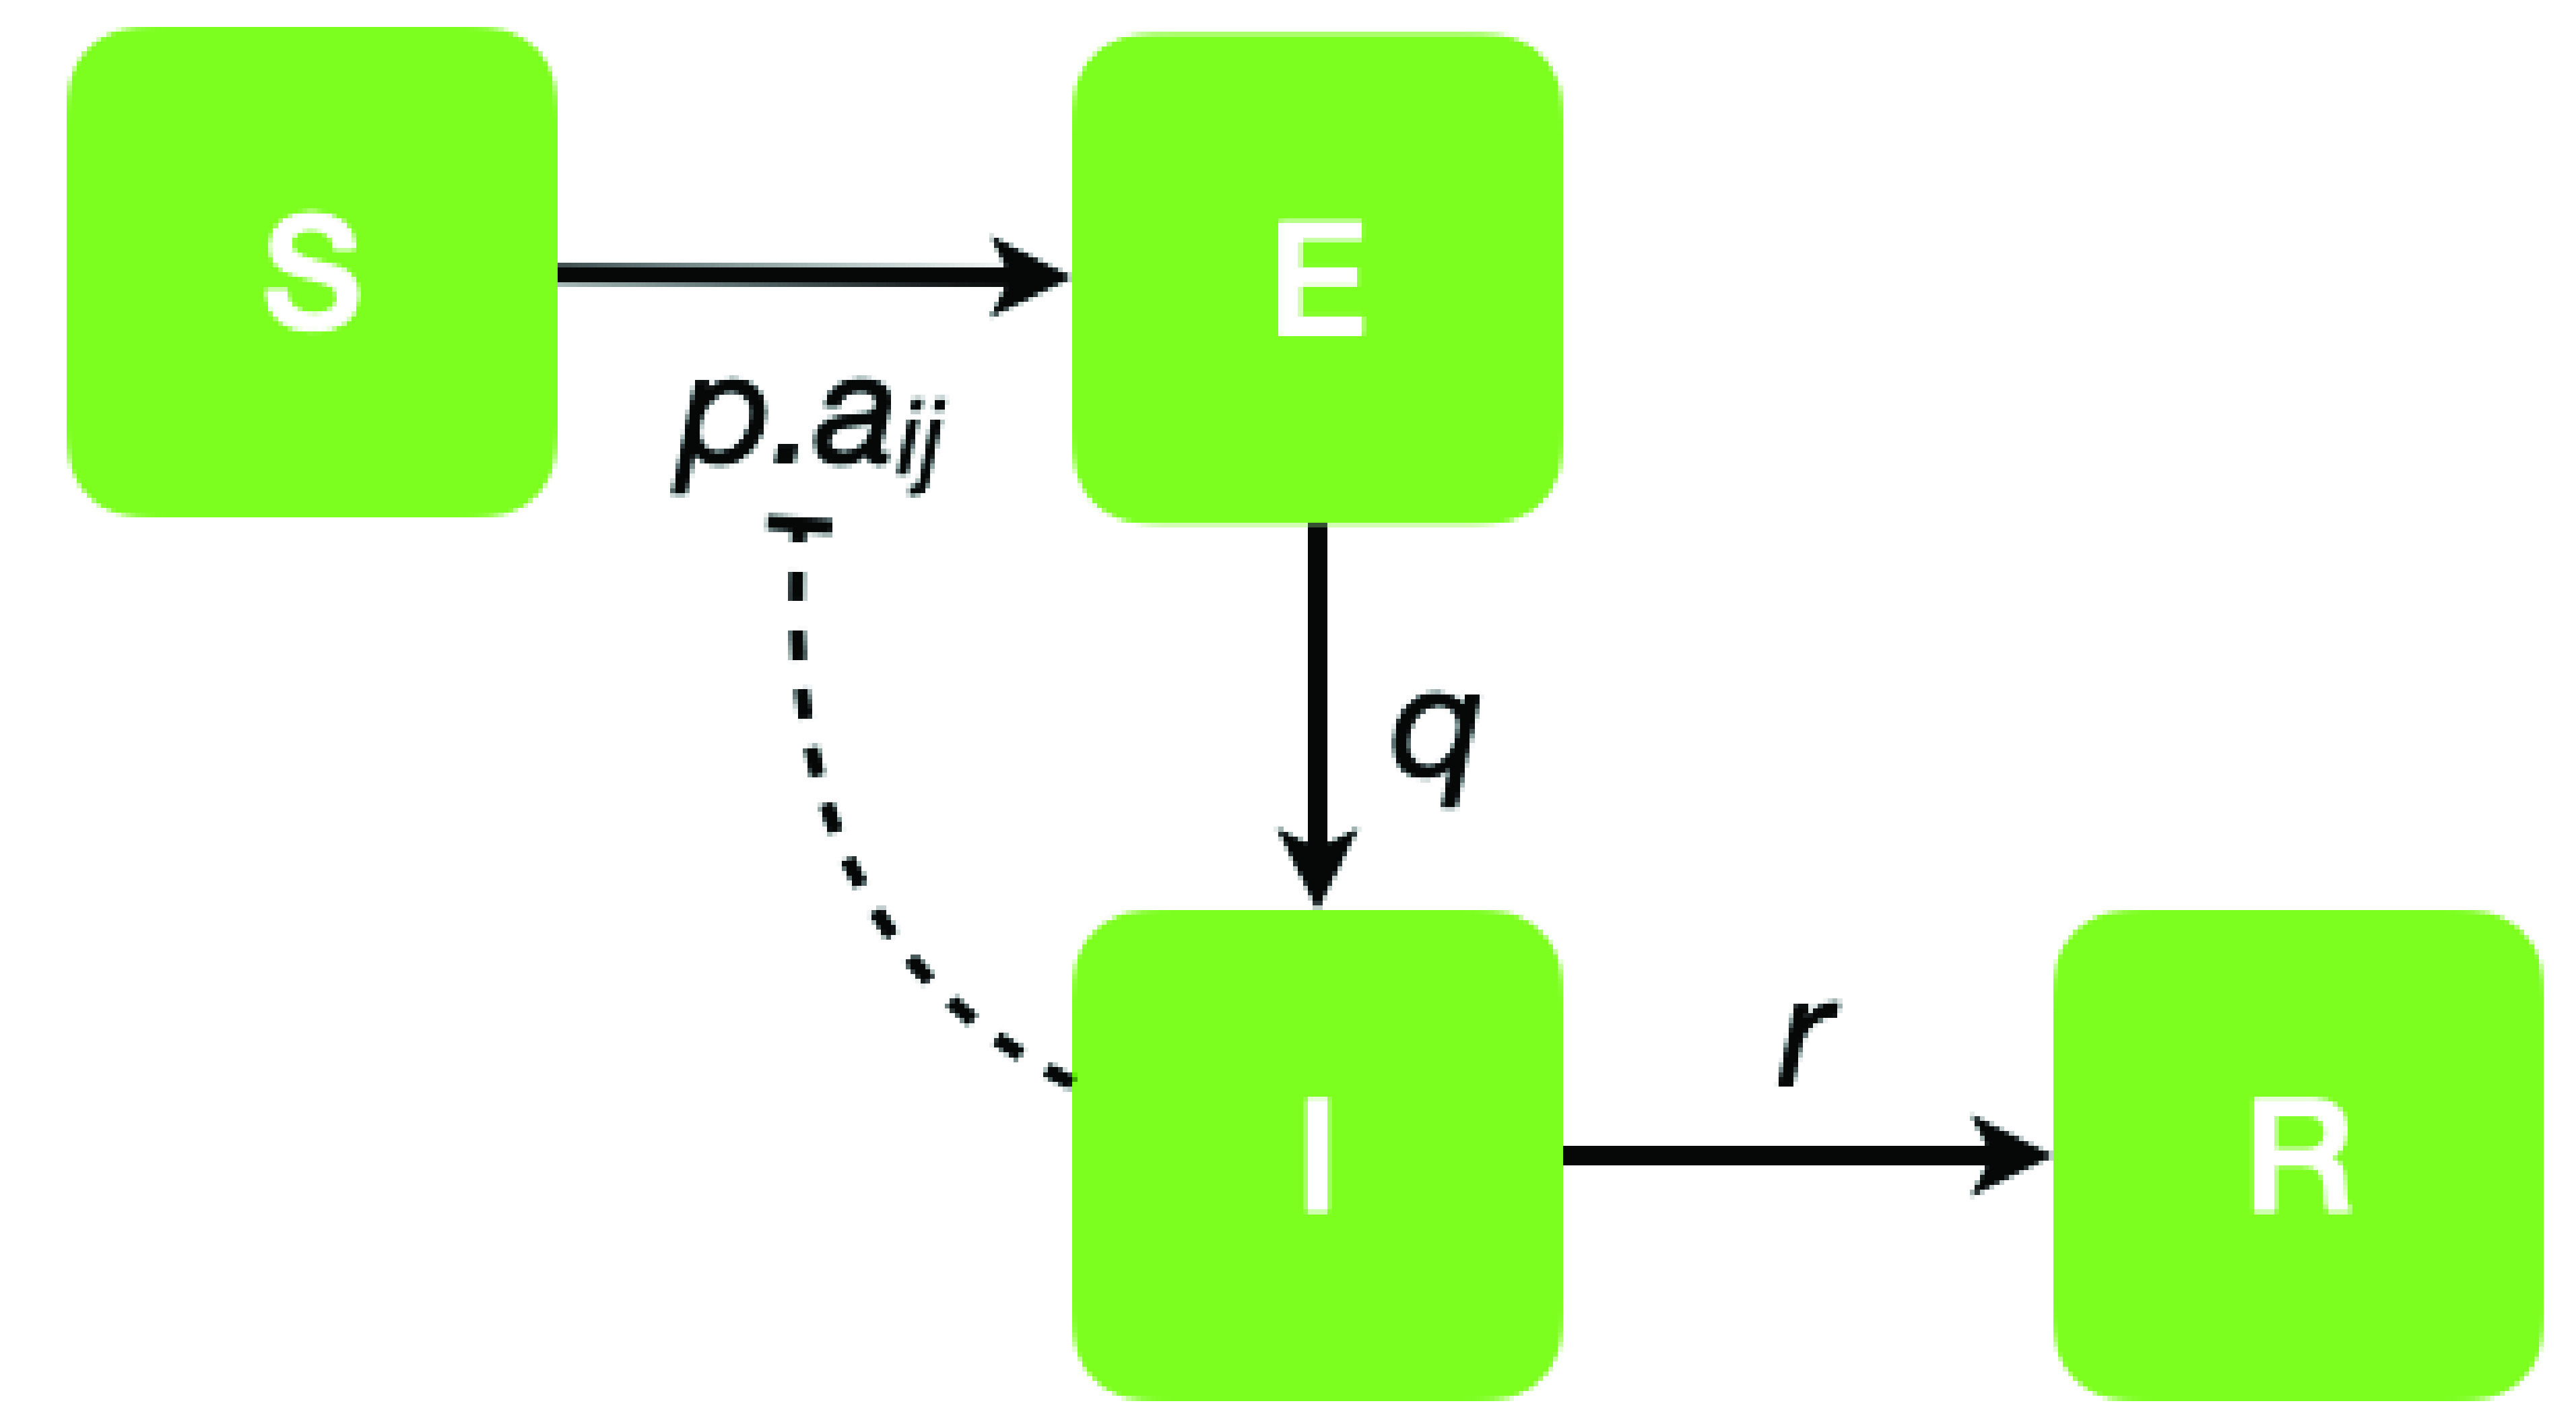
FIGURE 1.

Model flow chart. A Graphical representation of the model state transition process. Each node can be in one of four states  ,
,  ,
,  , or
, or  with transition between them determined by probabilities
  ,
,  and
and  and the contact process of elements
  of the network adjacency matrix
  . Hence node-
 has probability
  of being infected through contact with node-
 .
.
