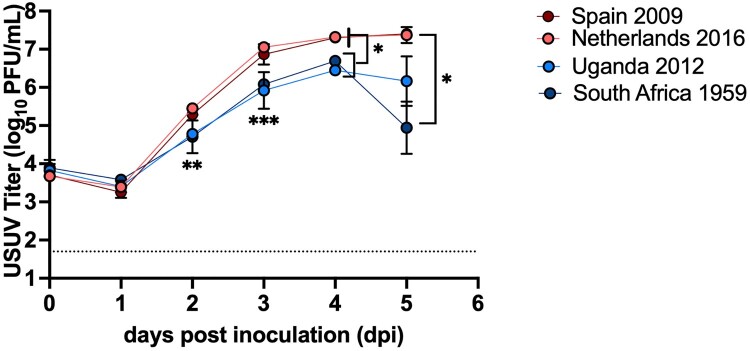
Figure 1.
Growth kinetics of USUV isolates in DF-1 cells. The growth curve was performed three times, with one representative experiment shown. Symbols represent mean and error bars represent standard deviation of triplicate inoculated cultures. The limit of detection is indicated by dashed line. *p < 0.05, **p < 0.01, ***p < 0.001.

