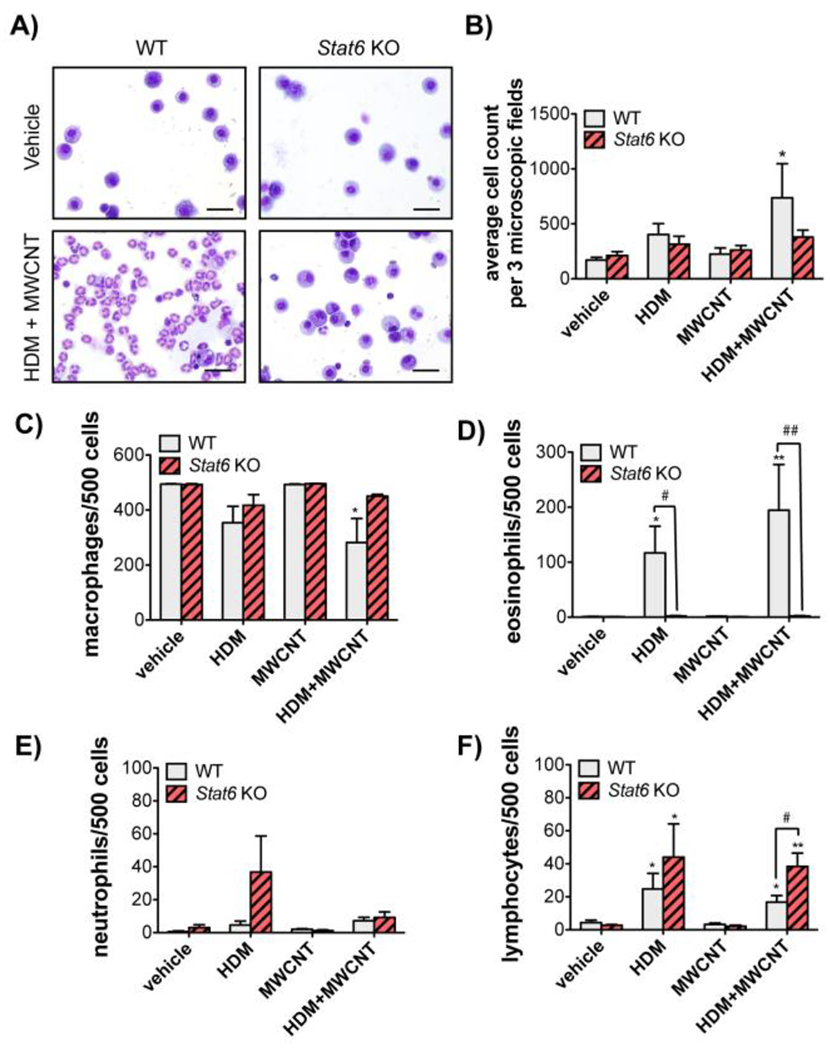
Figure 2. Analysis of inflammatory cells in the BALF of WT and Stat6 KO mice after exposure to MWCNTs with or without HDM allergen.

A) Representative photomicrographs of BALF cells isolated by Cytospin centrifugation from WT and Stat6 KO mice after exposure to vehicle or HDM extract and MWCNTs (Bars = 20 μm). B) Total cell counts from Cytospin slides in each treatment group from WT and Stat6 KO mice. Three microscopic frames per slide were counted at 100x magnification for each animal. *p<0.05 vs. vehicle, Mann-Whitney test. C) Numbers of macrophages per 500 cells in the BALF of animals from each treatment group. *p<0.05 vs. vehicle of same genotype. D) Numbers of eosinophils per 500 cells. *p<0.05 or **p<0.01 compared to vehicle in WT mice. #p<0.05 or ##p<0.01 between genotypes. One-way ANOVA. E) Numbers of neutrophils per 500 cells. F) Numbers of lymphocytes per 500 cells. *p<0.05 or **p<0.01 vs. vehicle of same genotype. #p<0.05 between genotypes, one-way ANOVA. N=4 to 6 animals per group for panels B-F.
