

Abstract
Changes in gut microbiota composition and a diverse role of B cells have recently been implicated in multiple sclerosis (MS), a central nervous system (CNS) autoimmune disease. Immunoglobulin A (IgA) is a key regulator at the mucosal interface. However, whether gut microbiota shape IgA responses and what role IgA cells have in neuroinflammation are unknown. Here, we identify IgA-bound taxa in MS and show that IgA-producing cells specific for MS-associated taxa traffic to the inflamed CNS resulting in a strong, compartmentalized IgA enrichment in active MS and other neuroinflammatory diseases. Unlike previously characterized polyreactive anti-commensal IgA responses, CNS IgA cross-reacts with surface structures on specific bacterial strains but not with brain tissue. These findings establish gut-microbiota-specific IgA cells as a systemic mediator in MS and suggest a critical role of mucosal B cells during active neuroinflammation with broad implications for IgA as a novel biomarker and IgA-producing cells as an immune subset to harness for therapeutic interventions.
One Sentence Summary:
IgA cells act as a systemic mediator between the gut and the central nervous system during active multiple sclerosis.
Introduction
MS is the most common chronic autoimmune disease of the CNS in adults affecting over 2.3 million people world-wide (1). Recently, gut microbiota composition has been implicated as a contributing factor to MS pathogenesis (2–11). However, the specific bacterial taxa that drive or exacerbate MS and the mechanisms by which those bacteria influence host immunity remain unclear. IgA, produced mostly at mucosal surfaces, is the predominant antibody isotype in humans and functions as a critical mediator of intestinal homeostasis (12–15). Mounting evidence suggests a major effect of mucosal microbiota in shaping the IgA B cell repertoire (16). In inflammatory bowel disease, IgA-coated microbiota have been shown to exhibit pathogenic activity (17–20). Although IgG is the main isotype in serum, a significant number of IgA-secreting cells circulate in peripheral blood (21), and recent evidence suggests that gut microbiota-reactive IgA plasma cells can also traffic to peripheral organs (22) and may play a role in other extra-intestinal autoimmune diseases (23). Notably, B cell depletion – a therapeutic strategy that spares plasma cells – leads to a dramatic reduction of inflammatory activity in MS (24, 25). In contrast, TACI-IgG, an agent that has a major depleting effect on the plasma cell compartment, resulted in disease exacerbations in MS (26). This highlights the complex and important role of the B cell lineage in the pathogenesis of MS and suggests that at least some plasma cells may play a potentially regulatory role during chronic neuroinflammation. Because TACI-APRIL interactions are important for IgA class switch, in this study, we sought to understand the role of IgA-producing cells in MS.
Results
IgA-SEQ identifies intestinal microbiota relevant to MS pathogenesis
To measure taxa-specific IgA coating in an unbiased and comprehensive manner, we applied IgA-SEQ (17), a technique that combines flow cytometry-based cell sorting with 16S ribosomal RNA (rRNA) gene sequencing (Fig. 1A and B) (27), using fecal specimens derived from MS patients in either remission (n=25) or relapse disease states (n=11) and healthy controls (n=31) (Data S1 and S2). Although, as previously reported, differences in the abundance of specific taxa between MS patients and controls were evident (4), and absolute IgA levels in the gut were different between relapse and remission (28), no significant differences between disease states of MS with respect to IgA-bound microbial taxa were identified (Fig. S1A and B; Data S2). Therefore, samples from MS relapse and remission cohorts were pooled for subsequent IgA-SEQ analyses. The proportion of differential IgA-bound operational taxonomic units (OTUs) was significantly higher in MS compared to controls (Fig. 1C). To quantify the enrichment, we calculated a global microbiota coating index (GMCI) (Fig. 1C). In assessing which specific taxa were preferentially IgA-coated, we found differentially abundant OTUs in the IgA+ and IgA− fractions of MS versus controls (Fig. 1D and E, Fig. S1C, Data S2). Akkermansia muciniphila, Eggerthella lenta, and Bifidobacterium adolescentis, which have been reported to be increased in MS and exert pro-inflammatory effects on T cells (3, 4, 29), were among the most prominent OTUs bound by IgA in MS patient samples in addition to Ruminococcus OTUs, which could not be further classified on species level. We next compared relative levels of IgA-coating between individual taxa and observed that these taxa had an elevated IgA coating index (ICI) in MS patient samples compared to controls (Fig. 1F). In contrast, specific Bacteroides OTUs, which are known inducers of T regulatory (Treg) responses (4, 30), were among the most frequent in the IgA+ fraction of controls (Fig. 1F, Fig. S1C, Data S2). Interestingly, we found that IgA-binding was linked to specific OTUs that did not necessarily reflect the most abundant taxa in the samples (Fig. 1F, Data S2). Also, we noted that the MS-associated IgA+ fraction showed enrichment for regulatory elements and metabolic enzymes (Fig. S1D, Data S2). These results suggest that IgA preferentially binds MS-associated bacteria highlighting their immune-stimulatory capacity.
Fig. 1. Identification of IgA-coated bacteria enriched in multiple sclerosis patients.
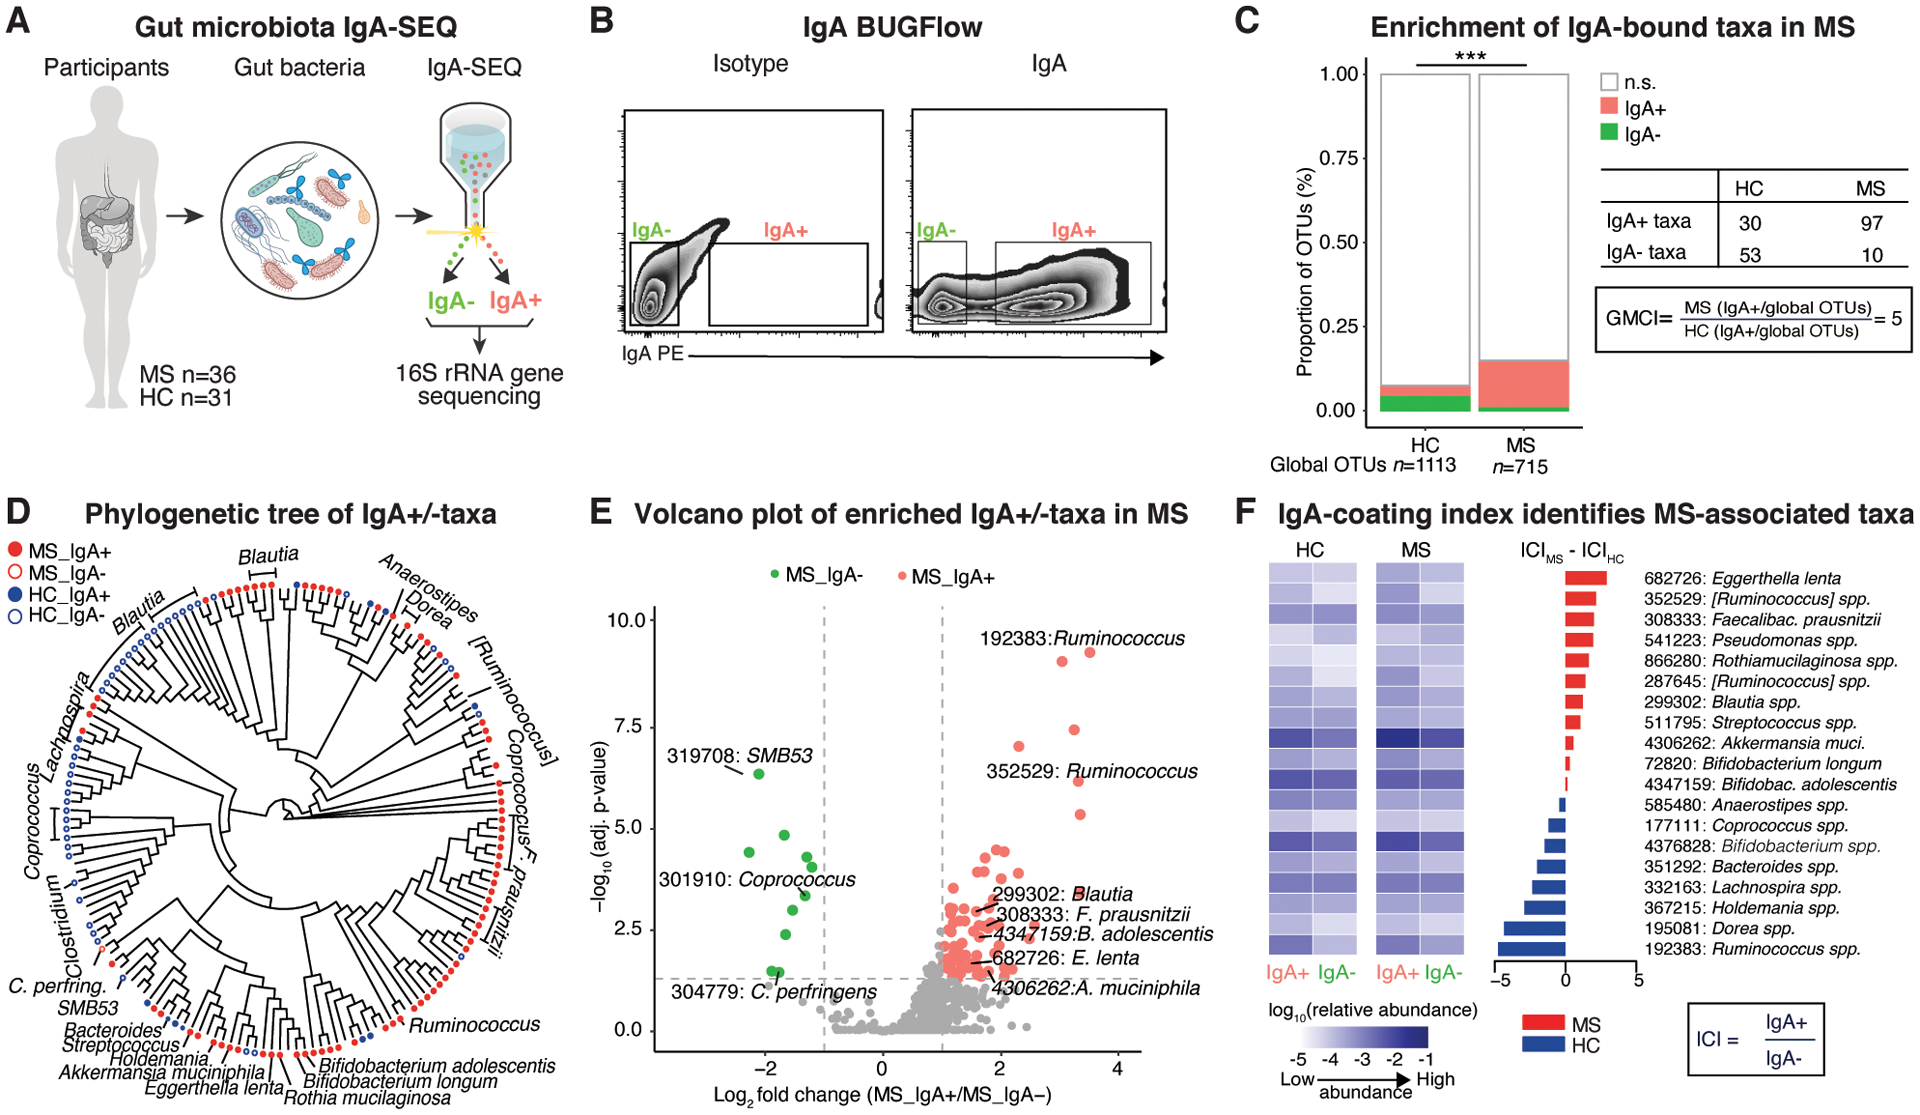
A, Overview of IgA-based cell sorting of fecal bacteria combined with 16S rRNA gene sequencing (IgA-SEQ) in multiple sclerosis (MS) (n=36) and healthy controls (HC) (n=31). B, Gating strategy for flow-cytometry based sorting of IgA-bound (IgA+) and -unbound (IgA-) bacteria. C, Relative counts of significant operational taxonomic units (OTUs) specific to the IgA+ and IgA- fractions, non-differential OTUs and global OTUs. Note significant differential enrichment of IgA-bound OTUs in MS compared to controls as shown by an elevated global microbiota coating index (GMCI). Fisher’s exact test. D, Phylogenetic tree based on IgA-SEQ of significantly different OTUs between IgA+ and IgA- in MS or HC. Circles represent OTUs overabundant in the respective IgA status. E, Volcano plots of significantly differential OTUs between IgA+ and IgA- in MS. Note enrichment of pro-inflammatory taxa in the IgA-bound fraction. F, Heatmap of average relative abundance (log base 10) of total, IgA+ and IgA- fractions of fecal bacteria and IgA coating index (ICI) scores from HC and MS for differential OTUs between IgA+ and IgA- in HC and MS, respectively. DESeq2, Benjamini-Hochberg correction for multiple comparisons.
CSF IgA is elevated during active inflammation in MS
While interactions between the intestinal microbiota and the immune system are thought to play a critical role in MS (11), the relevance of IgA immune responses to organ-specific autoimmune diseases such as MS is not well understood (31–37). To determine how IgA immune responses impact MS disease activity, we classified patients into MSinactive (remission) versus MSactive (relapse) using clinical and radiological metadata, and measured IgA and IgG levels in both blood and cerebrospinal fluid (CSF) (Figs. 2A and S2A, Data S1). We found a differential elevation of CSF IgA levels during active MS corresponding to clinical relapses (Fig. 2A) and MRI activity as measured by active lesion volume (Fig. S2A). In contrast, IgG levels were similarly elevated in the CSF of MS patients during relapse and remission (as known (34, 38)) (Fig. 2A). We next assessed blood-brain barrier IgA leakage by calculating the CSF:serum IgA ratio corrected for albumin (i.e., IgA index) and identified a significant increase in the IgA index during MS relapses, which indicates an intrathecal IgA production (Fig. 2A) in relation to IgG, which was already elevated at disease onset as expected (38). Further, we found CSF IgA levels to be significantly higher in active MS in comparison to neurodegenerative and healthy controls (Fig. 2A, Data S1), which was also the case in active neurosarcoidosis, another autoimmune neuroinflammatory disease, compared to the respective inactive disease state and controls (Fig. 2A). As expected, IgA levels were not elevated in the CSF of healthy controls and neurodegenerative disease (Fig. 2A). These findings suggest that IgA-producing B cells either traffic to the CNS or preferentially augment local IgA production during active neuroinflammation.
Fig. 2. Enrichment of IgA-producing cells during active CNS inflammation in MS and viral encephalitis.

A, Serum and CSF IgA and IgG levels during MS relapse (serum: n=13, CSF: n=11) and remission (serum: n=11, CSF: n=9); unpaired Student’s t-test. IgA and IgG index during relapse (n=6) compared to remission (n=11); unpaired Student’s t-test with Welch’s correction. CSF IgA in active and inactive MS in comparison to another neuroinflammatory condition (neurosarcoidosis: n=12), neurodegeneration (motor neuron diseases, MND: n=10) and healthy controls (HC: n=10); One-way ANOVA with Tukey’s multiple comparison test; Indicated are mean ± SEM. B, Spatial distribution and lineage of IgA+ B cells in active MS lesions. CD20 (cyan arrowheads), IgA (yellow arrowheads). C, Spatial transcriptomics of IGHA- to IGHG-expressing cells in subcortical perivascular versus meningeal and parenchymal infiltrates in active MS; two-tailed Mann-Whitney test. D, IGHA- and IGHG-expressing cells in inflamed meningeal aggregates (left), the majority of which co-express the plasma cell marker PRDM1 (yellow arrowheads). Presence of IGHG- and IGHA-expressing cells (co-expressed with PRDM1) in inflamed perivascular infiltrates (right). Note differential IL10 expression in immune cell subsets with increased expression in IGHA-expressing B cells (yellow arrowheads; orange arrowheads marks IL10-/IGHA+ cells), and lower/absent expression in T cells (CD3E) and macrophages (CD163) (blue arrowheads). E, F, Qualitative (E) and quantitative (F) assessment of IGHA- and IGHG-expressing B cells in inflamed viral encephalitis tissue (Borna disease virus 1, BoDV-1); note recruitment of IGHA- and IGHG-expressing B cells in perivascular spaces with relative enrichment of IGHA- over IGHG-expressing cells in parenchymal infiltrates. For IHC (B) and ISH (C-F) experiments, representative images from individual tissue sections are shown (ctrl, n = 5; MS, n = 12; BoDV-1, n= 5), meninges and perivascular white matter lesions are from the same tissue sections. Inflammatory lesion staging was carried out by MOG and CD68 IHC.
IgA B cells co-localize with inflammatory lesions in MS
To validate and further assess presence of IgA+ (CD19+) B cells in the inflamed CNS, we studied the localization and phenotype in post-mortem brain samples from MS patients and controls by protein and transcript analysis for IGHA and IGHG – encoding IgA and IgG proteins – in acute and chronic active MS lesions (39) in comparison to brain tissue from other neuroinflammatory and neurodegenerative diseases and healthy control brain tissue (Data S1). Utilizing immunohistochemistry (IHC) and in situ hybridization (ISH), we observed IgG+ and to a lesser degree IgA+ B cells within inflammatory meningeal aggregates adjacent to cortical demyelination (Fig. 2B to D, Data S1). A similar pattern was found in perivascular niches and parenchymal infiltrates of subcortical MS lesions (Fig. 2B to D). B cell subtype analysis demonstrated that most IgA+ cells were CD138+ and CD19+ (but not CD20+) suggesting a plasma cell phenotype (Fig. 2B). Large-area in situ hybridization confirmed that the majority of cells expressing IGHA (encoding the Ig heavy constant alpha segment) co-expressed PRDM1 encoding the plasma cell transcription factor Blimp-1 and localized to inflamed tissue areas in leukocortical MS lesions (Fig. 2B to D). Although, the major B/plasma cell subset in MS brains were IGHG-expressing cells, we observed a relative enrichment of IGHA-expressing B cells in parenchymal and perivascular spaces of the inflamed subcortical white matter (Fig. 2C to D). Further, we noticed a trend that the number of perivascular IGHA-expressing cells was associated with the level of inflammatory lesion activity as measured by the density of CD68+ macrophages (Fig. S2B). Next, based on our recent report that gut-derived plasma cells regulate neuroinflammation via IL-10 (15), we sought to assess IL10 expression in the MS CNS. We regularly IL10 transcripts in a subset of IgA B cells – as compared to T and myeloid cells – in inflamed MS lesion areas (Fig. 2D). In addition to MS, we found similar numbers of IgG+ and IgA+ B cells in inflamed leukocortical tissues from patients infected with Borna disease virus (BoDV-1), a single stranded neurotropic RNA virus, leading to encephalitis, which in most cases is fatal (40) (Fig. 2E to F). Conversely, we did not observe IgG+ and IgA+ B cells in post-mortem brain tissue from patients with hereditary or sporadic amyotrophic lateral sclerosis (a fatal neurodegenerative condition) and healthy controls (Fig. S2C). Taken together, strong enrichment of IgA B cell subsets was a common pathological feature in compartmentalized active MS lesions as well as in other active neuroinflammatory conditions.
IgA+ cells are a major component of the inflamed CSF plasma cell compartment with clonal connections to the periphery
To further understand the origin of CNS IgA B cells, we performed massively parallel RNA sequencing of the heavy chain B cell receptor (BCR) repertoires from blood and CSF of three active MS patients obtained during a relapse (Fig. 3, Fig. S3, Data S1 and S3). Specifically, we used bulk-sorted plasma cell subsets from blood and CSF (Fig. 3A, Fig. S3) from two patients (bBCR1 and bBCR2) and performed single-cell repertoire sequencing in the third patient (scBCR) (Fig. 3B, Data S3). Analysis of the full repertoire of bBCR1 from sorted B cell subsets (Fig. S3) revealed that a significant proportion of CSF B and plasma cell clusters were of the IgA isotype, and of those, all belonged to the IgA1 subclass. Indeed, we found that 33–100% of clonally related blood to CSF plasma cells/plasma cell clusters were IgA-producing cells in all three patients (Fig. 3A to D, Fig. S3). Related IgG2 plasma cells between blood and CSF were only found in one patient (bBCR2) (Fig. 3A), and no CSF plasma cell-blood clones were detected for any other Ig isotypes (Fig. 3A to C, Fig. S3, Data S3). CSF IgA-producing cells exhibited preferential usage of the large Ig heavy chain (IgH) subgroups distinguishable by expression of IGHV3 and IGHJ4 with an average CDR3 length of 15 amino acids (Fig. 3E, Data S3). This data suggests that clonally related IgA B cells traffic across the BBB during MS relapses corresponding to active inflammation.
Figure 3. IgA-producing cells traffic across the blood-brain barrier in active MS.

A-B, B cell receptor repertoire analysis from sorted plasma cell subsets (A) or single cells (B) from peripheral blood (PB, red) and cerebrospinal fluid (CSF, blue) (n=3). PC=plasma cells. Edges (lines): clonal connections between B cell subsets. PB-CSF connections: blue=clonal connections between IgA subsets, red=all other clonal connections. Node size and edge thickness are relative to the number of Ig-VH clusters and connections, respectively. C, Phylogenetic tree of CDR3 sequences from an IgA cluster shared between CSF and blood (patient bBCR2, (A)). Dots indicate amino acids identical to germline segments; color-shaded amino acids indicate differences from germline. D, CSF IgA B cell (clonal) frequencies. Shown are % CSF IgA of all CSF Ig clusters (left), % CSF-PB clonal connections of all CSF IgA (middle), % CSF-PB clonal connections of all CSF-PC Ig clonal connections. E, CSF IgA B cell receptor gene usage.
CNS-Infiltrating IgA B cells recognize gut microbiota but not brain antigens
Building on our previous finding that global IgA-coating in the gut was decreased during MS relapses (28), we hypothesized that CNS infiltrating IgA-producing cells originate from the gut and thus would express gut homing markers (Fig. S4A) and display gut microbiota reactivity (Fig. 4A). To that end, we assessed expression of mucosal homing markers ITGB7 encoding alpha 4 beta 7 integrin and CCR10 in IgA+ cells in MS brains in comparison to healthy colon tissue and found expression in the majority of IgA-producing cells in the MS brain tissue suggesting their gut origin (Fig. S4A). We next exposed CSF from MS patients during remission and relapse to autologous gut bacteria and quantified their IgA binding levels (Fig. 4A to B, Fig. S4B) in comparison to other neuroinflammatory and neurodegenerative diseases and healthy control (Fig. S4C). Notably, the frequency of patients with gut microbiota-reactive IgA in the CSF was elevated during relapsing MS (MSactive, 8/10, 80%) compared to remission (MSinactive, 0/7, 0%) (Fig. 4B) as well as in patients with active neurosarcoidosis but not in neurodegenerative disease or healthy controls (Fig. S4C). To determine if these CSF IgA antibodies originated from local IgA-producing B cells in MS, we synthesized 5 recombinant monoclonal antibodies derived from single IgA B cells obtained from the CSF of one patient (scBCR) during acute inflammation (Fig. 3B, Fig. 4A, Fig. S5). We then performed BUGFlow (Fig. S4D) and measured binding of the recombinant antibodies to autologous fecal bacteria (Fig. 4B to C). Remarkably, all 5 antibodies showed dose-dependent binding to autologous gut commensals (Fig. 4C) specifically reacting against representative isolates from bacterial species that are overabundant in MS patient stool including A. muciniphilia, E. lenta, and F. prausnitzii (Fig. 4D, Fig. S4E and F). Surprisingly, all antibodies showed specificities to distinct bacterial surface antigens including cross-reactivity of antibodies to surface antigens of bacterial strains from multiple phyla (Fig. 4D, Fig. S4E and F) but no reactivity to intracellular antigens as tested with bacterial lysates (Fig. S4G). In contrast, no reactivity against foreign and self-antigens was observed, including myelin peptide or proteins (myelin oligodendrocyte glycoprotein, MOG) (Fig. 4D, Fig. S4H) or against human brain tissue (Fig. 4D, Fig. S5). One antibody (mAb-5) showed low level cross-reactivity to influenza A and MOG1–125 by ELISA (Fig. 4D, Fig. S4H) without being broadly polyreactive or recognizing native conformational myelin protein (Fig. S4H) or human brain tissue (Fig. S5). Using a LPS assay (Fig. 4E) and a glycan array (Fig. S6A, Data S4), we fine-mapped the epitope of mAb1 to a microbial N-acetyl mannosamine (Fig. 4E, Fig. S6A and B). Regardless of reactivity, all recombinant antibodies showed evidence of affinity maturation (i.e., were somatically mutated) (Data S3) with signs of CDR3 convergence between clones in the CNS demonstrated in 2/5 (40%) of the tested antibodies (Data S3). Notably, the two antibodies that showed CDR3 convergence (mAb-2 and −3) exhibited highly similar microbiota-specificity. To further confirm trafficking of IgA plasma cells with distinct microbial specificities to the CNS during active disease, we quantified microbiota-reactive IgA plasma cells in the blood of an age-matched cohort of active MS patients and healthy controls using a commensal ELISPOT (Fig. S7A to B), and found a significant increase of commensal specific IgA-producing cells in active MS (Fig. S7A to B) which showed specificity for MS-associated strains (Fig. S7C to D). These results suggest that at least some IgA plasma cell clones originate from antigen-specific B cell responses to intestinal bacterial surface antigens in the gut that then migrate through the blood to preferentially traffic to the inflamed CNS during active/relapsing MS (Fig. 4F).
Figure 4. Microbial specificity of cerebrospinal fluid IgA B cells.

A, Strategy to characterize gut bacteria-reactivity of cerebrospinal fluid (CSF) IgA and recombinant monoclonal antibodies (mAbs) derived from single CSF IgA B cells from MS patients. B, CSF IgA-reactivity against autologous gut microbiota (remission, n=7; relapse, n=10). Fisher’s exact test. C, CSF mAb-reactivity against autologous gut microbiota (n=5) during acute inflammation. D, CSF mAb binding profile. Strains used are type-strains derived from ATCC or from an Eggerthellaceae collection. MOG=myelin oligodendrocyte glycoprotein, dsDNA=double stranded deoxyribonucleic acid. Dark blue=gram- strains, light blue=gram+ strains. E, Epitope mapping of mAb-1. Antibody reactivity against E. coli K235-derived lipopolysaccharide (LPS) and epitope identification using a glycan array. Shown are the repeating units of the capsular polysaccharides from Streptococcus pneumonia serotypes 4 and 9 with the common 2-N-acetyl mannosamine highlighted in red. F, Schematic illustrates working model of IL10-producing gut microbiota-specific IgA B cell trafficking during acute neuroinflammation in active MS.
Discussion
Here, we characterized IgA and IgA-producing B cells in the gut, blood, CSF and brain tissue of MS patients and other neuroinflammatory diseases. We found differential IgA-coating of gut bacteria in MS raising the possibility that MS-associated taxa contain immunoreactive motifs that are potent IgA inducers. These findings not only expand previous observations about IgA-bound bacterial-taxa in inflammatory bowel diseases (17, 19, 20) and bacterial metabolic enzymes triggering IgA responses (41) but provide novel insights into taxa-specific IgA responses in the gut in MS and suggest an enrichment of IgA-bound taxa as a marker for pro-inflammatory gut microbiota composition.
While plasma cells have been implicated in MS pathogenesis (42), previous studies have focused on the role of IgG-producing cells as the source of oligoclonal bands – one of the diagnostic hallmarks of MS (43). Although some studies have reported the presence of IgA in the CSF or CNS tissue of MS patients (31–37), the role of IgA and IgA-producing cells in MS is not well understood. Here, we observed a high frequency of CSF IgA B cells (as compared to IgG) in relapsing patients with active disease as compared to clinical remission. In contrast to elevated CSF IgG responses, which are present at disease diagnosis and might be a biomarker for diagnosis and clinical progression (43), we show that CSF IgA is elevated in MS relapses and correlates with acute inflammation in MS and other neuroinflammatory conditions, similar to ankylosing spondylitis, another autoimmune disease affecting the joints (44). Further, recent data from B cell repertoire analysis in other non-MS autoimmune diseases indicates increased clonality dominated by the IgA isotype in the blood of patients with systemic lupus erythematosus and Crohn’s disease suggesting microbial contributions also to other autoimmune diseases (23). Our observations therefore provide the rationale for further evaluating CSF IgA as a marker for acute inflammation in MS and other inflammatory diseases and future studies will have to clarify the role of IgA as a predictor for MS disease course (23, 33).
We noted a concomitant enrichment of IgA1 and IgG2-expressing plasma cell clones in the CSF during relapses in MS. Notably, IgG2 antibodies are typically induced by bacterial polysaccharides pointing to a mucosal-originating immune response during acute neuroinflammation. IgA responses can be mounted in the gut in an antigen-specific manner through high affinity T cell-dependent, or low affinity T-cell independent mechanisms, or in an antigen-nonspecific manner through glycan-dependent binding to certain bacteria (12, 14, 15). Interestingly, a recent study identified cross-specific antibody responses to minimal glycan epitopes abundantly expressed on microbial surfaces (45). Here, we link the increase of both IgA1- and IgG2-producing B cells to a specific microbial immune response, and identified IgA B cells as major constituent of the CSF during active inflammation in MS. Unlike previous studies, our findings suggest that gut commensals can elicit high-affinity, T cell-dependent responses with confined cross-reactivities across several taxa raising fundamental questions about the triggers and role of commensal-specific IgA cells in systemic disease.
Emerging studies point towards the existence of dynamic migration patterns of lymphocytes between the gut and distant tissues (22). Our work now adds to this accumulating evidence by demonstrating that commensal-reactive IgA B cells traffic to the inflamed CNS in MS. We propose that their commensal reactivity, the lack of evidence for self- and foreign antigen cross-reactivity and evidence for local IL-10 production suggest that these mucosal-originating IgA-producing B cells represent a population of potentially regulatory cells that are actively recruited to inflamed tissues, expanding on previous observations in mice (28).
The fact that IgA-producing cells with specificity to MS-associated immune-stimulatory bacterial strains were found in the CNS, raises fundamental questions about the underlying mechanisms of IgA-cell migration and function during active inflammation. It is conceivable that immune-stimulatory bacteria in the gut lead to an expansion of regulatory IgA-producing plasma cells that are recruited to the site of inflammation (CNS in this case) through inflammation-dependent but microbiota-independent triggers. Although no major differences in the overall composition of gut microbiota between relapse and remission were observed that would explain a composition-related shift in IgA-binding, we cannot exclude that strain specific differences are the drivers of that response. Alternatively, gut leakiness during acute neuroinflammation as recently suggested (46) and possible CNS penetration of gut microbiota may necessitate microbial containment by cross-species reactive IgA-producing cells in the acutely inflamed CNS. Further studies are needed to assess gut leakiness and potential CNS penetration of gut microbiota and to elucidate the mechanisms that facilitate IgA B cell recruitment to the CNS.
We propose that our study establishes gut microbiota-specific IgA-producing cells as a major constituent of the active immune response in MS with broad implications for the role of antigen-specific IgA responses in (neuro)inflammatory diseases and for the development of novel therapeutic strategies that potentially harness this anti-inflammatory gut-brain immune axis.
Materials and Methods:
Human study participants
Human participants for MS microbiome, blood and CSF studies.
Patients with clinically isolated syndrome (CIS) (n=4) or relapsing-remitting multiple sclerosis (RRMS) (n=39) (remission n=31, relapse n=12) and healthy controls (n=31) were recruited at the University of California, San Francisco (UCSF) MS and Neuroinflammation Center as part of the ORIGINS (an incident MS cohort) and EPIC (a longitudinal MS natural history cohort (47)) study. All individuals signed a written informed consent in accordance with the UCSF Institutional Review Board approved protocol. Diagnosis of CIS or RRMS was made based on the 2017 McDonald criteria (48). All patients were treatment-naïve (n=39) or off immunomodulatory treatment for more than 6 months (n=4) prior to fecal, blood and/or CSF sampling and did not receive steroids within at least 30 days prior to sampling. MS relapse was defined as the presence of new/exacerbated symptoms and gadolinium enhancement on brain or spinal cord magnetic resonance imaging. Clinical disease severity was assessed using the Expanded Disability Status Scale (EDSS) (Neurostatus) (49, 50). Age-matched controls sharing the same household were used where available for the microbiome study. The inclusion criteria specified no use of antibiotics or cancer therapeutics 3 months prior to the study and excluded a history of autoimmune disorders in healthy controls. Detailed clinical and epidemiological information on patients and controls is available (Data S1).
Fecal samples were collected, shipped within 24 hours at 4°C and stored at −80°C prior to bacterial isolation. For blood and CSF, patients either consented to donating excess CSF and blood during routine lumbar puncture (LP) at UCSF; if an LP was not ordered by the treating physician, participants consented to undergo LP and blood draw for research purposes. 7–30 mL of fresh CSF was centrifuged at 400 × g for 15 minutes at 4°C to separate the cell pellet from supernatant. Peripheral blood mononuclear cells (PBMCs) were isolated from whole blood via Ficoll gradient followed by red blood cell lysis and washing with phosphate buffered saline with 1% bovine serum albumin.
Human participants for neuroinflammatory, neurodegenerative and healthy control CSF studies.
CSF from neurosarcoidosis patients with diagnosis based on 2018 consensus criteria (51) and analysis restricted to biopsy-confirmed probably and definite cases, was collected as part of a larger UCSF Institutional Review Board approved cohort study applying metagenomic next generation sequencing to biological samples from patients (52). CSF from neurodegenerative (motor neuron diseases, MND) patients and healthy controls was collected at the University Hospital of Basel as part of the local prospective CSF biobank (53).
Human participants for autopsy brain tissue and biopsy study.
All MS and control tissue included in this study was provided by the UK MS Tissue Bank at Imperial College, London, UK (Data S1). Human MS and control tissue samples were obtained through a prospective donor scheme following ethical approval by the National Research Ethics Committee (08/MRE09/31). We selected leukocortical MS lesion tissue from cortical and subcortical areas harbouring acute (active-demyelinating) and chronic-active (active-demyelinating lesion rims) lesion areas with a similar degree of meningeal inflammation underlying cortical demyelination (39, 54). We examined a total of 12 snap-frozen brain tissue blocks obtained at autopsies from secondary progressive MS (female n=7, male n=5) (39) and control subjects (female n=1, male n=4). The age of the MS patients ranged from 34 to 65 (median 50) and of the controls from 35 to 82 years (median 64). The disease duration of the MS patients ranged from 11 to 40 years (median 23 years). Autopsy tissue from three patients with confirmed Borna disease virus 1 (BoDV-1) encephalitis (40) was examined following approval by the local ethical committee of the Technical University of Munich (577/19-S). Age of the BoDV-1 patients ranged from 13 to 74 (median 50) (Data S1). Autopsy tissue from patients with amyotrophic lateral sclerosis (ALS) was obtained from Umeå University Hospital, Sweden, through a prospective donor scheme following approval by the Ethical Review Boards for Medical Research (55). The age of the patients (i.e., sporadic ALS and familial-C9orf72HRE mutant ALS) ranged from 67 to 76 (median 70) (Data S1). Colon tissues were obtained from hemicolectomy preparation of four patients (female n=3, male n=1). For all patients, surgery was performed due to an adenocarcinoma of the colon and the aboral resection margin as was chosen for each preparation. The age of the patients ranged from 52 to 84 (median 76).
Bacterial Flow Cytometry (BUGFlow)
Bacterial flow cytometry (BUGFlow) was performed as previously described (17). In brief, 1 million isolated fecal bacteria or bacterial strains were stained in staining buffer (PBS containing 1% (w/v) bovine serum albumin (BSA, Sigma). For sorting of IgA-bound bacteria, autologous gut bacteria were blocked for 20 min with subsequent incubation of 30 min with PE-conjugated anti-human IgA (1:10, Miltenyi Biotec, clone IS11–8E10) or the respective isotype control (1:10, Miltenyi Biotec, mouse IgG1). For binding assays with CSF or recombinant antibodies, samples were incubated for 1 hour on ice with CSF supernatant (1:5), patient-derived recombinant antibodies (dilution series) or rabbit anti-E. coli (polyclonal, 1:100, Abcam) (positive control) followed by washing, and staining with buffer containing PE-conjugated anti-human IgG (clone HP6017, 1:20, BioLegend), PE-conjugated anti-rabbit IgG (polyclonal, 1:1000, Abcam) or respective isotype control for 30 min on ice. Samples were then washed three times before flow cytometric sorting on a FACSAria II (Beckton Dickinson) or fixed with 2% paraformaldehyde before flow cytometric analysis on an LSRFortessa (Beckton Dickinson). Bacteria were gated based on forward and side scatter, and the gating strategy was verified by SYTOBC (Invitrogen). An isotype control was used to identify the stained population. For CSF binding, samples that showed reactivity in 2 independent experiments were considered positive.
In case of subsequent sorting, we collected 1 million events from the IgA+ population and at least 100,000 commensal microbial cells from the IgA- input into sterile sorting buffer. Each fraction was stored at –80°C before amplification and sequencing of bacterial 16S rRNA genes. Analysis of IgA binding was done using FlowJo software (v10.1). Multiple precautions were taken to minimize potential contamination of sorted fractions as previously reported (19): (i) freshly autoclaved PBS was used for sheath fluid; (ii) the flow cytometer was sterilized according to the manufacturer’s recommended protocol; (iii) the sheath fluid filter was replaced routinely; and (iv) 16S rRNA analysis was performed on samples collected from the flow cytometer droplet stream before and after every sort as well as from the reagents used (mock sample without bacteria), thus permitting identification of any sequences that did not originate from the sorted sample.
16S rRNA gene analysis
DNA was prepared from fecal samples using the PowerFecal DNA Isolation Kit (Qiagen). The V4 region of the 16S rRNA gene was amplified in triplicate as previously described (56). Triplicate reactions were combined and purified using the SequalPrep Normalization Plate Kit (Invitrogen) according to the manufacturer’s specifications. Purified amplicons were quantitated using the Qubit dsDNA HS Assay Kit and pooled at equimolar concentrations. The amplicon library was concentrated using the Agencourt AMPure XP system (Beckman-Coulter) quantitated using the KAPA Library Quantification Kit (KAPA Biosystems) and diluted to 2nM. Equimolar PhiX was added at 40% final volume to the amplicon library and sequenced in a paired-end 153bp × 153bp format on an Illumina NextSeq500 machine. In total, 142 samples were sequenced (Data S1 and S2).
Raw sequence data was converted from bcl to fastq format using bcl2fastq v2.16.0.10. R1/R2 fastq data were merged using the program FLASh (Fast Length Adjustment of SHort reads) (57) with a minimum overlap of 25bp. Merged pairs were then demultiplexed using “split_libraries_fastq.py” in QIIME (58) and passed through USEARCH (59) fastq_filter to remove any sequences that contain more than two expected errors.
Amplicon reads were assigned to OTUs using a closed-reference OTU picking protocol against Greengenes database (v13.8) at 97% identity by using QIIME (58). Taxonomy was assigned to each read by accepting the Greengenes taxonomy string of the best matching Greengenes sequence. The sequences were rarified to 70,000 reads per sample, and 134 samples were kept for downstream analyses. OTUs were filtered to retain the ones present in at least 5% of samples, covering at least 100 total reads. Alpha- and Beta-diversity were measured by Shannon index and weighted UniFrac distance, respectively. Paired and non-paired differential analyses between IgA+ and IgA-, MS (relapse and remission patient subsets) and healthy controls were performed using DESeq2 R package (60) with Benjamini-Hochberg correction for multiple comparisons. OTU representative sequences were picked and aligned against Greengenes. The aligned sequences were then used to build the phylogenetic tree by the fasttree method in QIIME. An IgA coating index (ICI) for each differential OTU (adjusted P-value < 0.05) was calculated as follows: ICI = relative abundance (IgA+)/relative abundance (IgA-). PICRUSt1.0.0 (Phylogenetic Investigation of Communities by Reconstruction of Unobserved States) (61) was applied to predict metagenome content of the microbiota samples from the 16S rRNA profiles, and KEGG orthologies (KOs) were categorized. Differential analysis of KOs between MS patients and healthy controls was performed using the DESeq2 R package with Benjamini-Hochberg correction for multiple comparisons.
To identify enriched OTUs bound by each mAb, we divided the relative abundance of each OTU within the sample by the relative abundance within the whole microbiota bound by all antibodies. OTUs were kept only if the relative abundance was larger than 0.05% and enrichment score lager than 0.5 in any of the five mAb-bound samples. Phylogenetic tree of enriched OTUs were built based on the phylogenetic distance of the representative sequences of all OTUs.
Ig quantification in serum and CSF
IgA in serum and CSF was quantified using a commercially available quantitative ELISA assay (Human IgA ELISA Kit, Abcam). IgG was measured as part of routine clinical testing with a nephelometric assay. Intrathecal immunoglobulin synthesis (Ig index) was calculated by correcting for albumin.
Immunohistochemistry
16 μm-cryosections were collected on superfrost slides (VWR) using a CM3050S cryostat (Leica Microsystems) and fixed in either 4% PFA at room temperature (RT), ice-cold methanol or ice-cold acetone. Next, sections were blocked in 0.01M (= 1X) PBS/0.01% Triton X-100/ 10% goat sera for 1 hour at RT. Primary antibody incubations were carried out overnight at 4°C. The following antibodies were used for immunohistochemistry: goat biotinylated anti-human IgA (polyclonal, 1:100, Southern Biotech), mouse anti-human CD138 (clone DL-101, 1:100, BioLegend), mouse anti-human CD19 (clone HIB19, 1:20, BioLegend), rabbit anti-human CD20 (clone SP32, 1:300, Thermo Fisher), mouse anti-human CD68 (514H12, 1:200, Millipore Sigma), mouse anti-human MOG (818C5, 1:1000, Bio-Rad), humanized anti-MOG (h818C5, 1 μg/ml) rabbit anti-E.coli (polyclonal, 1:500, Abcam). After three-step washing in 0.1M PBS, cryosections were incubated with secondary antibodies diluted in 1X PBS/ 0.01% Triton X-100 for 2 hours at room temperature. For chromogenic assays, sections were incubated with biotinylated secondary IgG antibodies (1:500, Thermo Fisher) followed by avidin-biotin complex for a 1-hour incubation (1:500, Vector) and subsequent colour revelation using diaminobenzidine according to the manufacturer’s recommendations (DAB, Dako). For immunofluorescence, Alexa fluorochrome-tagged secondary IgG antibodies (1:500, Thermo Fisher) or biotinylated secondary-fluorochrome-tagged streptavidin complexes (for additional signal amplification) were used for primary antibody detection. Slides with fluorescent antibodies were mounted with DAPI Fluoromount-G (SouthernBiotech). Negative control sections without primary antibodies were processed in parallel. For diagnostic purposes, hematoxylin and eosin (HE) and Luxol fast blue (LFB) staining was carried out.
Chromogenic and fluorescent single/duplex/multiplex in situ RNA hybridization
Single molecule in situ hybridization (ISH) was performed according to previous published protocols (39) and manufacturer’s recommendations (RNAscope 2.5 red kit, duplex chromogenic manual assay kit and multiplex fluorescent v2 assay kit) to overcome technical difficulties such as high levels of background auto-fluorescence in inflamed white matter and lipofuscin in neurons of archival human brain samples (39). Sequences of target probes, preamplifier, amplifier, and label probes are proprietary and commercially available (Biotecne, Advanced Cell Diagnostics). Typically, target probes contain 20 ZZ probe pairs (approx. 50 bp/pair) covering 1000 bp. The following human manual RNAscope assay probes were used: IGHA1, IGHG1, IL10, IGHG1-C2, PRDM1-C2, IL10-C2, CCR10-C2, CD3E-C3, CD163-C3, IL10-C3, ITGB7-C3. After duplex single molecule in situ hybridization, we performed hematoxylin staining of nuclei. For multiplex fluorescent v2 assays, slides were stained with TSA Plus Fluorophores (Fluorescein, Cyanine3, Cyanine5) and DAPI. As quality control, channel-specific negative and positive ISH probes for each were run in parallel.
MRI acquisition and analysis
MRI images were acquired on the same 3T Skyra scanner (Siemens) following a standardized protocol that included: isotropic 3D T1-weighted magnetization-prepared gradient echo images (MPRAGE), isotropic 3D T2-weighted fluid-attenuated inversion recovery (FLAIR), and axial T2/PD-weighted dual echo spin echo images of the brain; sagittal whole spine T2-weighted and short tau inversion recovery (STIR) images. In addition, brain 3D T1-weighted MPRAGE and sagittal whole spine T1-weighted images were acquired after administration of gadobutrol. Brain T2 lesion masks were created from T2-FLAIR images using a semi-automatic lesion segmentation algorithm (62) as implemented in the Lesion Segmentation Toolbox (LST) version 3.0.0 (www.statistical-modelling.de/lst.html) for SPM. Lesion masks of gadolinium enhancing lesions were created from the T2 lesion masks by manually erasing the non-enhancing portion of the lesion and adjusting the T2 lesion boundary to that of the T1 lesion. MRI scans were done at the time of sample collection and all MRI analyses were performed blinded to the clinical and immunological data.
Bulk BCR sequencing
CSF and PBMCs were treated as stated above. For BCR repertoire analysis, CSF and PBMC samples were immediately blocked with FcR Block (Miltenyi Biotec) and stained with fluorescent antibodies to the cell surface markers CD19, CD27, CD38, CD138, IgD and sorted as previously described (63) on a MoFlo Astrios EQ (Beckman Coulter): naïve B cells (N: CD19+IgD+CD27−), unswitched memory B cells (USM: CD19+IgD+CD27+), switched memory B cells (SM: CD19+IgD-CD27+), double negative B cells (DN: CD19+IgD−CD27−), and PB plasma cells (PC: CD19+IgD−CD27+CD38+), and CSF plasmablast/plasma cells (PC: CD19+IgD−CD27high). B cells were sorted directly into lysis buffer suitable for later RNA extraction (Qiagen, buffer RLT+ 1% β-mercaptoethanol) and stored at −80°C.
We performed immunoglobulin profiling following the protocol from Turchaninova et al (64). In brief, we synthesized cDNA with heavy or light chain Ig targeted primers and template switch adaptor. cDNA was amplified by first semi-nested and second nested PCR amplification. We used each PCR product to prepare a sequencing library using the NEBNext Ultra II FS DNA library prep kit for Illumina (New England Biolabs). Each sample was barcoded at the library preparation step and libraries were pooled. Sequencing was performed using a paired-end 400bp × 200bp asymmetric format on an Illumina MiSeq platform.
Bulk immune repertoire analysis
A custom bioinformatics pipeline incorporating MiXCRv2.1.9 (65) was used to identify IgH germline genes and the H-CDR3 from raw paired-end sequencing reads. BCR sequences with a count greater than five and minimum quality H-CDR3>30 (Phred score) were included. In a B cell subset from one patient, bBCR1 CSF USM, the total number of BCR sequences was greater than the cell count (as determined by flow cytometry). In this case, the final set of BCR sequences was restricted by cell count, using the most highly abundant sequences. BCR using identical IGHV (Immunoglobulin heavy chain Variable region gene) and IGHJ (Immunoglobulin heavy chain Joining region gene) germline segments and identical or near-identical H-CDR3 regions (minimum 8 amino acid length, maximum Hamming distance of 2 at the amino acid level) were considered members of a clonally-related Ig-VH cluster (63). Network diagrams were generated to visualize relationships between the Ig-VH clusters in the blood and CSF within patients using Cytoscape (66). Heavy chain BCR sequences were analysed in IgBLAST (67). Mutations from germline were identified using IgBLAST and displayed using Geneious (v10.0).
Single-cell BCR sequencing
CSF supernatant was removed, the cell pellet was gently resuspended, and lymphocytes were counted via hemocytometer. An aliquot of PBMCs was enriched for B cells, and a second aliquot was enriched for memory B cells via bead-based selections (EasySep Human Pan-B cell enrichment kit, and EasySep Human Memory B Cell Isolation Kit, respectively, StemCell Technologies). Isolated peripheral blood B cells and unenriched PBMCs were resuspended in 2% serum. Single cells were isolated on a droplet-based single cell isolation platform (10X Genomics), and individual heavy and light chain Ig sequences were identified using the Chromium Single Cell V(D)J kit (10X Genomics) and paired-end 150bp × 150 bp sequencing on an Illumina NovaSeq platform. Two lanes of CSF cells were isolated as single cells on the same platform: 7,711 and 4,938 cell input, respectively, one lane of 17,400 PBMCs, one lane of 18,125 peripheral blood B cells, and one lane of 18,565 peripheral blood memory B cells. Estimated cell count input was based on manual hemocytometer count.
Single-cell immune repertoire analysis
Collective clonotype results produced by Cell Ranger (v3.0.1) were analysed using custom scripts written in Perl and R. Ig-VH clonally related clusters were identified based on the same criteria as described above for the bulk immune repertoire sequencing analysis.
Recombinant IgA antibodies
Full-length variable BCR sequences (FR1 to FR4) obtained from 5 single CSF IgA B cells from one patient (scBCR, RRMS_Relapse_9) fused to the human IgG1 constant region were cloned into LakePharma’s (Belmont, CA) high expression mammalian vector system, transiently expressed in human embryonic kidney (HEK)-293 cells and purified via Protein A using standard methodology.
Bacterial strains
Bacterial type strains were purchased from the American Type Culture Collection (ATCC) (Acinetobacter calcoaceticus, Akkermansia muciniphilia, Bacteroides adolescentis, Bacteroides fragilis, Clostridium perfringens, E. coli strains, Eggerthella lenta type strain, Enterococcus faecalis) and Deutsche Sammlung von Mikroorganismen und Zellkulturen GmbH (DSMZ) (Prevotella copri). E. coli MP1 strain was obtained from Mark Goulian (University of Pennsylvania, USA). The collection of Eggerthellaceae strains has been previously described (68).
Bacterial (lysate) ELISA
1 million intact autologous gut bacteria or heat-inactivated (65°C, 30 min) and sonicated (10 min) autologous gut bacteria were coated on a maxisorb ELISA plate (Nunc) in PBS in triplicates and incubated over night at 4°C. Plates were then washed and blocked with 3% BSA in PBS for 2 hours at room temperature before incubating 1 hour with the recombinant antibodies followed by anti-human IgG HRP (Jackson) for one hour at room temperature. After washing, the assay was developed with TMB (Abcam).
Polyreactivity assays
Antibody responses against self and foreign antigens were performed in quadruplicate reactions using commercially available assays according to manufacturer’s instructions (dsDNA, LSBio; hMOG, Anaspec; Influenza A, Abcam; LPS, alpha Diagnostic international). Antibodies against conformational MOG were measured using a cell based-assay as previously described (69, 70).
Glycan array
Glycan Array Printing.
Glycan microarray slides were prepared by robotically spotting solutions on NHS activated glass slides (71). In detail, synthetic glycans were dissolved in printing buffer (50 mM sodium phosphate, pH 8.5) at a concentration of 100μM. Solutions were transferred to a 384 well V bottom plate (Genetix) and robotically printed onto NHS activated glass slides (CodeLink slides, Surmodics) using an S3 non-contact microarray spotter (Scienion) equipped with a Type 4 coated nozzle (PDC80). The printing pattern is shown in Fig. S6. Humidity in the printing chamber was kept constant at 39% during the entire print run. Following printing, slides were incubated overnight at room temperature in a humidity-saturated chamber. Remaining reactive groups were quenched by incubating the slides in quenching solution (50 mM sodium phosphate, 100 mM ethanolamine, pH 9) at room temperature for one hour. Slides were washed twice with water, dried by centrifugation at 300 × g for three minutes (Eppendorf CombiSlide system) and stored dry at 4 °C until use.
Glycan Array Screening.
Directly before the assay, the slides were blocked with a solution of 3% (w/v) BSA in PBS (BSA-PBS) for 60 min at room temperature, washed twice with PBS and once with double deionized water, afterwards dried by centrifugation. A 16 well and 64 well incubation gasket (FlexWell™ Incubation Chambers, Grace BioLabs) was attached to the slide and primary antibody dilutions (in BSA-PBS) in different concentrations (10μg/mL and 20μg/mL) were added in duplicate to the glycan arrays. After incubation for 1h at room temp, slides were washed three times with PBS containing 0.1% (v/v) Tween-20 (PBST) by adding 120 μL (16 well) and 50μl (64 well) to each well. The secondary antibody (goat anti-human IgG-H+L AlexaFluor® 647, 1:400, A21445, Invitrogen), diluted in 3% (w/v) BSA-PBS, was directly added to the wells of the gaskets and incubated for 1h at room temperature in the dark. After incubation, slides were washed twice with PBS-T, twice with PBS, rinsed with deionized water and dried by centrifugation (300 × g, 3 min) prior to scanning with a GenePix 4300A microarray scanner (Molecular Devices). Intensities were evaluated as mean fluorescence intensity of circles of identical diameter for all glycans with local background subtraction using GenePix 7 (Molecular Devices).
Commensal-specific ELISPOT
Membrane plates (High Protein Binding Immobilon-P membrane, Millipore) were coated with 1mg/ml of heat-killed inactivated (60min at 65°C) defined human microbiome ecosystem (RePOOPulate) (72)or with 1ug/ml of heat killed inactivated MS-associated (Akkermansia muciniphilia, Facelibacterium prausnitzii, Eggerthella lenta) or non-MS associated (Parabacteroides distasonis, Bacteroides fragilis, Eubacterium rectale) bacteria strains, plates were kept at 4°C overnight. Plates were blocked the next morning with 10% FBS/RPMI (Sigma) for 2 hours at 37°C. PBMC were thawed and incubated for two hours with 50ng/ml of Fc-BAFF, and, after checking viability, a B/PC cell enrichment was performed using an EasySep Pan B cell enrichment kit (Stemcell) following manufacturer’s instructions. Single B/PC cell suspensions were loaded onto the plate at serial 2-fold dilutions in 10%FBS/RPMI/50ng/ml of Fc-BAFF and left overnight at 37°C. Cells were removed the next morning and plates were washed with 0.1% TWEEN-20/PBS 3x, leaving the third wash in the plate while rotating on an orbital shaker for 15 min and washed twice more. AP-conjugated IgA detection antibody was subsequently added for 2 hours. Plates were washed again as before and developed while covered with aluminium foil for at least 9 minutes or until spots were visible using Vector Blue (Vector Laboratories) substrates. Plates were dried overnight and spots were counted based on the original cell dilution.
Image acquisition and analysis
For analysis of in situ hybridization data (number of IGHA1- and IGHG1-expressing cells), we quantified cells on average in 4–11 representative regions of interest (ROIs) per tissue block and took the average per tissue block for statistical analysis. For meningeal and perivascular spaces, ROIs were defined by measuring the area of meningeal/vascular tissue subtracting any empty spaces related to meningeal/vascular lumen or tissue artefacts. For parenchymal cell densities, we quantified cells in 4–11 circular areas (= parenchymal ROIs) within a radius of 300 μm surrounding a central blood vessel; note that the (peri)vascular space was not included in the quantification of parenchymal cell densities. Bright field images were acquired on Zeiss Axio Imager 2 and Leica DMi8 microscopes equipped with Zeiss Axiocam 512 color and Leica DMC5400 cameras. Fluorescent images were taken with Leica TCS SP8 laser confocal (405/488/552/638 nm) and DMi8 widefield (equipped with Leica DFC7000 GT camera) microscopes with 10x, 20x, 40x or 63x objectives; fluorescent confocal pictures are Z-stack images, unless stated otherwise. Images were processed using Fiji ImageJ (v2.0) and exported to vector-based software (Adobe Illustrator and Affinity Designer) for figure generation.
Statistical analysis
Data are presented as mean ± standard error of mean (SEM). Analyses were performed using parametric (Student’s t-test: normally distributed data with equal variances; Welch’s t-test: normally distributed data with unequal variances; One-way ANOVA with Tukey’s multiple comparison test: normally distributed data with equal variances) or non-parametric (Mann-Whitney U, Wilcoxon paired test, Friedman and Kruskal-Wallis tests: non-Gaussian distribution data) tests. Fisher’s exact test was used to determine nonrandom associations between two categorical variables. A least squares regression model was used to analyze associations of IgA CSF levels with the average volume of gadolinium enhancing brain lesions, adjusted for age, sex and disease duration. All tests were performed using 2-tailed analysis. Significance cut-off was set at p<0.05. P values were designated as follows: *P ≤ 0.05, **P ≤ 0.01, ***P ≤ 0.001, ****P ≤ 0.0001. Statistical analyses were performed using GraphPad Prism software version 7.0 or JMP Statistics software version 14.3.0.
Supplementary Material
Acknowledgments:
We thank all patients for their study participation, Refujia Gomez and the UCSF EPIC & ORIGINS Study Team for aids in patient recruitment, and Erica Eggers, Rita Loudermilk, Stacy Caillier, Adam Santaniello, Mikail Öztürk, Haleigh Miller, Valentina Alonso, and Anne-Catherine Lecourt for technical assistance. We also thank the UCSF Parnassus Flow Cytometry Core, which is supported by the Diabetes Research Center (DRC) grants NIH P30 DK063720 and NIH S10 15100D021822-01, and Drs. Susan Lynch and Douglas Fadrosh from the UCSF Microbiome Research Core. We would like to also thank Dr. Djordje Gveric for selecting and providing human brain samples from the UK Multiple Sclerosis Tissue Bank, funded by the Multiple Sclerosis Society of Great Britain and Northern Ireland. Further, we thank Drs. Noah W. Palm and Andrew L. Kau for valuable aids in establishing the IgA-SEQ technique, Dr. Emma Allen-Vercoe for providing the RePOOPulate template, Dr. Mark Goulian for providing the E. coli MP1 strain, Dr. Jeff Gordon for providing the monoclonal anti-B. thetaiotaomicron antibody, and Dr. Klaus Dornmair for providing the humanized 818C5 antibody. Finally, we thank Anna Hupalowska for assistance with schematic illustrations.
Funding:
Swiss National Science Foundation fellowships (P2SKP3_164938/1; P300PB_177927/1) and National Multiple Sclerosis Society (NMSS) fellowship (Kathleen C. Moore Fellowship: FG-1708-28871) (A.-K.P.); student fellowships from the Medical Faculty Mannheim, University of Heidelberg (S.W.) and the Hertie Foundation (M.K.); NMSS Clinician Scientist Development Award (Kathleen C. Moore Fellowship: FAN-1507-05497) (A.L.G.); NMSS-American Brain Foundation (ABF) Clinician Scientist Development Award (FAN-1608-25607) (R.D.S.); grants from the Swedish Brain Foundation (2012-0262, 2012-0305, 2013-0279, 2016-0303), the Swedish Science Council (2012-3167, 2017-03100), the Knut and Alice Wallenberg Foundation (2014.0305) (P.A.); P.H.S. thanks the Max-Planck Society for generous financial support; Debbie and Andy Rachleff Foundation (M.R.W.); research grants from the Hertie Foundation (medMS MyLab, P1180016) and NMSS (FG-1902-33617) (L.S.); Distinguished Professor in Neurology at UCSF and Heidrich Friends and Family endowed chair in Neurology at UCSF (S.E.B.); Valhalla Charitable Foundation (S.E.B.).
Footnotes
Competing interests: None.
Data and materials availability: The datasets generated and analyzed during the current study will be made available in the EMBL-EBI repository [accession ID: PRJEB32763] upon publication of the manuscript. Code used throughout this study is available upon request.
References and Notes
- 1.Thompson AJ, Baranzini SE, Geurts J, Hemmer B, Ciccarelli O, Multiple sclerosis. Lancet 391, 1622–1636 (2018). [DOI] [PubMed] [Google Scholar]
- 2.Berer K, Mues M, Koutrolos M, Rasbi ZA, Boziki M, Johner C, Wekerle H, Krishnamoorthy G, Commensal microbiota and myelin autoantigen cooperate to trigger autoimmune demyelination. Nature 479, 538–541 (2011). [DOI] [PubMed] [Google Scholar]
- 3.Berer K, Gerdes LA, Cekanaviciute E, Jia X, Xiao L, Xia Z, Liu C, Klotz L, Stauffer U, Baranzini SE, Kümpfel T, Hohlfeld R, Krishnamoorthy G, Wekerle H, Gut microbiota from multiple sclerosis patients enables spontaneous autoimmune encephalomyelitis in mice. Proceedings of the National Academy of Sciences of the United States of America 114, 10719–10724 (2017). [DOI] [PMC free article] [PubMed] [Google Scholar]
- 4.Cekanaviciute E, Yoo BB, Runia TF, Debelius JW, Singh S, Nelson CA, Kanner R, Bencosme Y, Lee YK, Hauser SL, Crabtree-Hartman E, Sand IK, Gacias M, Zhu Y, Casaccia P, Cree BAC, Knight R, Mazmanian SK, Baranzini SE, Gut bacteria from multiple sclerosis patients modulate human T cells and exacerbate symptoms in mouse models. Proceedings of the National Academy of Sciences of the United States of America 114, 10713–10718 (2017). [DOI] [PMC free article] [PubMed] [Google Scholar]
- 5.Cekanaviciute E, Pröbstel A-K, Thomann A, Runia TF, Casaccia P, Katz Sand I, Crabtree E, Singh S, Morrissey J, Barba P, Gomez R, Knight R, Mazmanian S, Graves J, Cree BAC, Zamvil SS, Baranzini SE, Multiple Sclerosis-Associated Changes in the Composition and Immune Functions of Spore-Forming Bacteria. mSystems 3, 353 (2018). [DOI] [PMC free article] [PubMed] [Google Scholar]
- 6.Jangi S, Gandhi R, Cox LM, Li N, von Glehn F, Yan R, Patel B, Mazzola MA, Liu S, Glanz BL, Cook S, Tankou S, Stuart F, Melo K, Nejad P, Smith K, Topçuolu BD, Holden J, Kivisäkk P, Chitnis T, De Jager PL, Quintana FJ, Gerber GK, Bry L, Weiner HL, Alterations of the human gut microbiome in multiple sclerosis. Nature communications 7, 12015 (2016). [DOI] [PMC free article] [PubMed] [Google Scholar]
- 7.Miyake S, Kim S, Suda W, Oshima K, Nakamura M, Matsuoka T, Chihara N, Tomita A, Sato W, Kim S-W, Morita H, Hattori M, Yamamura T, Dysbiosis in the Gut Microbiota of Patients with Multiple Sclerosis, with a Striking Depletion of Species Belonging to Clostridia XIVa and IV Clusters. PloS one 10, e0137429 (2015). [DOI] [PMC free article] [PubMed] [Google Scholar]
- 8.Cantarel BL, Waubant E, Chehoud C, Kuczynski J, DeSantis TZ, Warrington J, Venkatesan A, Fraser CM, Mowry EM, Gut microbiota in multiple sclerosis: possible influence of immunomodulators. Journal of investigative medicine : the official publication of the American Federation for Clinical Research 63, 729–734 (2015). [DOI] [PMC free article] [PubMed] [Google Scholar]
- 9.Tremlett H, Fadrosh DW, Faruqi AA, Hart J, Roalstad S, Graves J, Spencer CM, Lynch SV, Zamvil SS, Waubant E, U. N. o. P. M. Centers, Associations between the gut microbiota and host immune markers in pediatric multiple sclerosis and controls. BMC neurology 16, 182 (2016). [DOI] [PMC free article] [PubMed] [Google Scholar]
- 10.Tremlett H, Fadrosh DW, Faruqi AA, Zhu F, Hart J, Roalstad S, Graves J, Lynch S, Waubant E, U. N. o. P. M. Centers, Gut microbiota in early pediatric multiple sclerosis: a case-control study. European journal of neurology : the official journal of the European Federation of Neurological Societies 23, 1308–1321 (2016). [DOI] [PMC free article] [PubMed] [Google Scholar]
- 11.Probstel AK, Baranzini SE, The Role of the Gut Microbiome in Multiple Sclerosis Risk and Progression: Towards Characterization of the “MS Microbiome”. Neurotherapeutics 15, 126–134 (2018). [DOI] [PMC free article] [PubMed] [Google Scholar]
- 12.Bunker JJ, Bendelac A, IgA Responses to Microbiota. Immunity 49, 211–224 (2018). [DOI] [PMC free article] [PubMed] [Google Scholar]
- 13.Rollenske T, Macpherson AJ, Anti-commensal Ig-from enormous diversity to clear function. Mucosal immunology 13, 1–2 (2020). [DOI] [PubMed] [Google Scholar]
- 14.Pabst O, Slack E, IgA and the intestinal microbiota: the importance of being specific. Mucosal immunology 13, 12–21 (2020). [DOI] [PMC free article] [PubMed] [Google Scholar]
- 15.Sterlin D, Fadlallah J, Slack E, Gorochov G, The antibody/microbiota interface in health and disease. Mucosal immunology 13, 3–11 (2020). [DOI] [PubMed] [Google Scholar]
- 16.Li H, Limenitakis JP, Greiff V, Yilmaz B, Scharen O, Urbaniak C, Zund M, Lawson MAE, Young ID, Rupp S, Heikenwalder M, McCoy KD, Hapfelmeier S, Ganal-Vonarburg SC, Macpherson AJ, Mucosal or systemic microbiota exposures shape the B cell repertoire. Nature 584, 274–278 (2020). [DOI] [PubMed] [Google Scholar]
- 17.Palm NW, de Zoete MR, Cullen TW, Barry NA, Stefanowski J, Hao L, Degnan PH, Hu J, Peter I, Zhang W, Ruggiero E, Cho JH, Goodman AL, Flavell RA, Immunoglobulin A coating identifies colitogenic bacteria in inflammatory bowel disease. Cell 158, 1000–1010 (2014). [DOI] [PMC free article] [PubMed] [Google Scholar]
- 18.Stephens WZ, Round JL, IgA targets the troublemakers. Cell host & microbe 16, 265–267 (2014). [DOI] [PubMed] [Google Scholar]
- 19.Kau AL, Planer JD, Liu J, Rao S, Yatsunenko T, Trehan I, Manary MJ, Liu T-C, Stappenbeck TS, Maleta KM, Ashorn P, Dewey KG, Houpt ER, Hsieh C-S, Gordon JI, Functional characterization of IgA-targeted bacterial taxa from undernourished Malawian children that produce diet-dependent enteropathy. Science translational medicine 7, 276ra224 (2015). [DOI] [PMC free article] [PubMed] [Google Scholar]
- 20.Viladomiu M, Kivolowitz C, Abdulhamid A, Dogan B, Victorio D, Castellanos JG, Woo V, Teng F, Tran NL, Sczesnak A, Chai C, Kim M, Diehl GE, Ajami NJ, Petrosino JF, Zhou XK, Schwartzman S, Mandl LA, Abramowitz M, Jacob V, Bosworth B, Steinlauf A, Scherl EJ, Wu H-JJ, Simpson KW, Longman RS, IgA-coated E coli enriched in Crohn's disease spondyloarthritis promote TH17-dependent inflammation. Science translational medicine 9, eaaf9655 (2017). [DOI] [PMC free article] [PubMed] [Google Scholar]
- 21.Mei HE, Yoshida T, Sime W, Hiepe F, Thiele K, Manz RA, Radbruch A, Dörner T, Blood-borne human plasma cells in steady state are derived from mucosal immune responses. Blood 113, 2461–2469 (2009). [DOI] [PubMed] [Google Scholar]
- 22.Shalapour S, Lin X-J, Bastian IN, Brain J, Burt AD, Aksenov AA, Vrbanac AF, Li W, Perkins A, Matsutani T, Zhong Z, Dhar D, Navas-Molina JA, Xu J, Loomba R, Downes M, Yu RT, Evans RM, Dorrestein PC, Knight R, Benner C, Anstee QM, Karin M, Inflammation-induced IgA+ cells dismantle anti-liver cancer immunity. Nature 551, 340–345 (2017). [DOI] [PMC free article] [PubMed] [Google Scholar]
- 23.Bashford-Rogers RJM, Bergamaschi L, McKinney EF, Pombal DC, Mescia F, Lee JC, Thomas DC, Flint SM, Kellam P, Jayne DRW, Lyons PA, Smith KGC, Analysis of the B cell receptor repertoire in six immune-mediated diseases. Nature 574, 122–126 (2019). [DOI] [PMC free article] [PubMed] [Google Scholar]
- 24.Hauser SL, Waubant E, Arnold DL, Vollmer T, Antel J, Fox RJ, Bar-Or A, Panzara M, Sarkar N, Agarwal S, Langer-Gould A, Smith CH, Group HT, B-cell depletion with rituximab in relapsing-remitting multiple sclerosis. The New England journal of medicine 358, 676–688 (2008). [DOI] [PubMed] [Google Scholar]
- 25.Hauser SL, Bar-Or A, Comi G, Giovannoni G, Hartung H-P, Hemmer B, Lublin F, Montalban X, Rammohan KW, Selmaj K, Traboulsee A, Wolinsky JS, Arnold DL, Klingelschmitt G, Masterman D, Fontoura P, Belachew S, Chin P, Mairon N, Garren H, Kappos L, O. I. a. O. I. C. Investigators, Ocrelizumab versus Interferon Beta-1a in Relapsing Multiple Sclerosis. The New England journal of medicine 376, 221–234 (2017). [DOI] [PubMed] [Google Scholar]
- 26.Kappos L, Hartung H-P, Freedman MS, Boyko A, Radü EW, Mikol DD, Lamarine M, Hyvert Y, Freudensprung U, Plitz T, van Beek J, Group AS, Atacicept in multiple sclerosis (ATAMS): a randomised, placebo-controlled, double-blind, phase 2 trial. Lancet neurology 13, 353–363 (2014). [DOI] [PubMed] [Google Scholar]
- 27.Moor K, Fadlallah J, Toska A, Sterlin D, Balmer ML, Macpherson AJ, Gorochov G, Larsen M, Slack E, Analysis of bacterial-surface-specific antibodies in body fluids using bacterial flow cytometry. Nature protocols 11, 1531–1553 (2016). [DOI] [PubMed] [Google Scholar]
- 28.Rojas OL, Pröbstel A-K, Porfilio EA, Wang AA, Charabati M, Sun T, Lee DSW, Galicia G, Ramaglia V, Ward LA, Leung LYT, Najafi G, Khaleghi K, Garcillán B, Li A, Besla R, Naouar I, Cao EY, Chiaranunt P, Burrows K, Robinson HG, Allanach JR, Yam J, Luck H, Campbell DJ, Allman D, Brooks DG, Tomura M, Baumann R, Zamvil SS, Bar-Or A, Horwitz MS, Winer DA, Mortha A, Mackay F, Prat A, Osborne LC, Robbins C, Baranzini SE, Gommerman JL, Recirculating Intestinal IgA-Producing Cells Regulate Neuroinflammation via IL-10. Cell 177, 492–493 (2019). [DOI] [PubMed] [Google Scholar]
- 29.Tan TG, Sefik E, Geva-Zatorsky N, Kua L, Naskar D, Teng F, Pasman L, Ortiz-Lopez A, Jupp R, Wu H-JJ, Kasper DL, Benoist C, Mathis D, Identifying species of symbiont bacteria from the human gut that, alone, can induce intestinal Th17 cells in mice. Proceedings of the National Academy of Sciences of the United States of America 113, E8141–E8150 (2016). [DOI] [PMC free article] [PubMed] [Google Scholar]
- 30.Round JL, Mazmanian SK, Inducible Foxp3+ regulatory T-cell development by a commensal bacterium of the intestinal microbiota. Proceedings of the National Academy of Sciences of the United States of America 107, 12204–12209 (2010). [DOI] [PMC free article] [PubMed] [Google Scholar]
- 31.Zhang Y, Da R-R, Hilgenberg LG, Tourtellotte WW, Sobel RA, Smith MA, Olek M, Nagra R, Sudhir G, van den Noort S, Qin Y, Clonal expansion of IgA-positive plasma cells and axon-reactive antibodies in MS lesions. Journal of neuroimmunology 167, 120–130 (2005). [DOI] [PubMed] [Google Scholar]
- 32.Vrethem M, Fernlund I, Ernerudh J, Ohman S, Prognostic value of cerebrospinal fluid IgA and IgG in multiple sclerosis. Multiple sclerosis 10, 469–471 (2004). [DOI] [PubMed] [Google Scholar]
- 33.Kroth J, Ciolac D, Fleischer V, Koirala N, Krämer J, Muthuraman M, Luessi F, Bittner S, Gonzalez-Escamilla G, Zipp F, Meuth SG, Groppa S, Increased cerebrospinal fluid albumin and immunoglobulin A fractions forecast cortical atrophy and longitudinal functional deterioration in relapsing-remitting multiple sclerosis. Multiple sclerosis 25, 338–343 (2019). [DOI] [PubMed] [Google Scholar]
- 34.Edwards KR, Goyal J, Plavina T, Czerkowicz J, Goelz S, Ranger A, Cadavid D, Browning JL, Feasibility of the use of combinatorial chemokine arrays to study blood and CSF in multiple sclerosis. PloS one 8, e81007 (2013). [DOI] [PMC free article] [PubMed] [Google Scholar]
- 35.Stern JNH, Yaari G, Vander Heiden JA, Church G, Donahue WF, Hintzen RQ, Huttner AJ, Laman JD, Nagra RM, Nylander A, Pitt D, Ramanan S, Siddiqui BA, Vigneault F, Kleinstein SH, Hafler DA, OConnor KC, B cells populating the multiple sclerosis brain mature in the draining cervical lymph nodes. Science translational medicine 6, 248ra107 (2014). [DOI] [PMC free article] [PubMed] [Google Scholar]
- 36.Schafflick D, Xu CA, Hartlehnert M, Cole M, Schulte-Mecklenbeck A, Lautwein T, Wolbert J, Heming M, Meuth SG, Kuhlmann T, Gross CC, Wiendl H, Yosef N, Meyer Zu Horste G, Integrated single cell analysis of blood and cerebrospinal fluid leukocytes in multiple sclerosis. Nature communications 11, 247–214 (2020). [DOI] [PMC free article] [PubMed] [Google Scholar]
- 37.Howell OW, Reeves CA, Nicholas R, Carassiti D, Radotra B, Gentleman SM, Serafini B, Aloisi F, Roncaroli F, Magliozzi R, Reynolds R, Meningeal inflammation is widespread and linked to cortical pathology in multiple sclerosis. Brain : a journal of neurology 134, 2755–2771 (2011). [DOI] [PubMed] [Google Scholar]
- 38.Sabatino JJ, Pröbstel A-K, Zamvil SS, B cells in autoimmune and neurodegenerative central nervous system diseases. Nature reviews. Neuroscience 18, 123–745 (2019). [DOI] [PubMed] [Google Scholar]
- 39.Schirmer L, Velmeshev D, Holmqvist S, Kaufmann M, Werneburg S, Jung D, Vistnes S, Stockley JH, Young A, Steindel M, Tung B, Goyal N, Bhaduri A, Mayer S, Engler JB, Bayraktar OA, Franklin RJM, Haeussler M, Reynolds R, Schafer DP, Friese MA, Shiow LR, Kriegstein AR, Rowitch DH, Neuronal vulnerability and multilineage diversity in multiple sclerosis. Nature 388, 1545 (2019). [DOI] [PMC free article] [PubMed] [Google Scholar]
- 40.Liesche F, Ruf V, Zoubaa S, Kaletka G, Rosati M, Rubbenstroth D, Herden C, Goehring L, Wunderlich S, Wachter MF, Rieder G, Lichtmannegger I, Permanetter W, Heckmann JG, Angstwurm K, Neumann B, Märkl B, Haschka S, Niller H-H, Schmidt B, Jantsch J, Brochhausen C, Schlottau K, Ebinger A, Hemmer B, Riemenschneider MJ, Herms J, Beer M, Matiasek K, Schlegel J, The neuropathology of fatal encephalomyelitis in human Borna virus infection. Acta neuropathologica 138, 653–665 (2019). [DOI] [PMC free article] [PubMed] [Google Scholar]
- 41.Okai S, Usui F, Yokota S, Hori-I Y, Hasegawa M, Nakamura T, Kurosawa M, Okada S, Yamamoto K, Nishiyama E, Mori H, Yamada T, Kurokawa K, Matsumoto S, Nanno M, Naito T, Watanabe Y, Kato T, Miyauchi E, Ohno H, Shinkura R, High-affinity monoclonal IgA regulates gut microbiota and prevents colitis in mice. Nature microbiology 1, 16103 (2016). [DOI] [PubMed] [Google Scholar]
- 42.Ramesh A, Schubert RD, Greenfield AL, Dandekar R, Loudermilk R, Sabatino JJ Jr., Koelzer MT, Tran EB, Koshal K, Kim K, Probstel AK, Banerji D, University of California SFMSET, Guo CY, Green AJ, Bove RM, DeRisi JL, Gelfand JM, Cree BAC, Zamvil SS, Baranzini SE, Hauser SL, Wilson MR, A pathogenic and clonally expanded B cell transcriptome in active multiple sclerosis. Proc Natl Acad Sci U S A 117, 22932–22943 (2020). [DOI] [PMC free article] [PubMed] [Google Scholar]
- 43.Gasperi C, Salmen A, Antony G, Bayas A, Heesen C, Kümpfel T, Linker RA, Paul F, Stangel M, Tackenberg B, Bergh FT, Warnke C, Weber F, Wiendl H, Wildemann B, Zettl UK, Ziemann U, Zipp F, Tumani H, Gold R, Hemmer B, G. C. N. o. M. Sclerosis, Association of Intrathecal Immunoglobulin G Synthesis With Disability Worsening in Multiple Sclerosis. JAMA neurology 76, 841–849 (2019). [DOI] [PMC free article] [PubMed] [Google Scholar]
- 44.Cowling P, Ebringer R, Ebringer A, Association of inflammation with raised serum IgA in ankylosing spondylitis. Annals of the rheumatic diseases 39, 545–549 (1980). [DOI] [PMC free article] [PubMed] [Google Scholar]
- 45.Rollenske T, Szijarto V, Lukasiewicz J, Guachalla LM, Stojkovic K, Hartl K, Stulik L, Kocher S, Lasitschka F, Al-Saeedi M, Schröder-Braunstein J, von Frankenberg M, Gaebelein G, Hoffmann P, Klein S, Heeg K, Nagy E, Nagy G, Wardemann H, Cross-specificity of protective human antibodies against Klebsiella pneumoniae LPS O-antigen. Nature immunology 19, 617–624 (2018). [DOI] [PubMed] [Google Scholar]
- 46.Buscarinu MC, Cerasoli B, Annibali V, Policano C, Lionetto L, Capi M, Mechelli R, Romano S, Fornasiero A, Mattei G, Piras E, Angelini DF, Battisitni L, Simmaco M, Umeton R, Salvetti M, Ristori G, Altered intestinal permeability in patients with relapsing-remitting multiple sclerosis: A pilot study. Multiple sclerosis (Houndmills, Basingstoke, England) 390, 135245851665249 (2016). [DOI] [PubMed] [Google Scholar]
- 47.University of California, San Francisco MS-EPIC Team, Cree BAC, Hollenbach JA, Bove R, Kirkish G, Sacco S, Caverzasi E, Bischof A, Gundel T, Zhu AH, Papinutto N, Stern WA, Bevan C, Romeo A, Goodin DS, Gelfand JM, Graves J, Green AJ, Wilson MR, Zamvil SS, Zhao C, Gomez R, Ragan NR, Rush GQ, Barba P, Santaniello A, Baranzini SE, Oksenberg JR, Henry RG, Hauser SL, Silent progression in disease activity-free relapsing multiple sclerosis. Annals of neurology 85, 653–666 (2019). [DOI] [PMC free article] [PubMed] [Google Scholar]
- 48.Thompson AJ, Banwell BL, Barkhof F, Carroll WM, Coetzee T, Comi G, Correale J, Fazekas F, Filippi M, Freedman MS, Fujihara K, Galetta SL, Hartung H-P, Kappos L, Lublin FD, Marrie RA, Miller AE, Miller DH, Montalban X, Mowry EM, Sørensen PS, Tintoré M, Traboulsee AL, Trojano M, Uitdehaag BMJ, Vukusic S, Waubant E, Weinshenker BG, Reingold SC, Cohen JA, Diagnosis of multiple sclerosis: 2017 revisions of the McDonald criteria. Lancet neurology 17, 162–173 (2018). [DOI] [PubMed] [Google Scholar]
- 49.Kappos L, D’Souza M, Lechner-Scott J, Lienert C, On the origin of Neurostatus. Multiple sclerosis and related disorders 4, 182–185 (2015). [DOI] [PubMed] [Google Scholar]
- 50.Kurtzke JF, Rating neurologic impairment in multiple sclerosis: an expanded disability status scale (EDSS). Neurology 33, 1444–1452 (1983). [DOI] [PubMed] [Google Scholar]
- 51.Stern BJ, Royal W, Gelfand JM, Clifford DB, Tavee J, Pawate S, Berger JR, Aksamit AJ, Krumholz A, Pardo CA, Moller DR, Judson MA, Drent M, Baughman RP, Definition and Consensus Diagnostic Criteria for Neurosarcoidosis: From the Neurosarcoidosis Consortium Consensus Group. JAMA neurology 75, 1546–1553 (2018). [DOI] [PubMed] [Google Scholar]
- 52.Wilson MR, O’Donovan BD, Gelfand JM, Sample HA, Chow FC, Betjemann JP, Shah MP, Richie MB, Gorman MP, Hajj-Ali RA, Calabrese LH, Zorn KC, Chow ED, Greenlee JE, Blum JH, Green G, Khan LM, Banerji D, Langelier C, Bryson-Cahn C, Harrington W, Lingappa JR, Shanbhag NM, Green AJ, Brew BJ, Soldatos A, Strnad L, Doernberg SB, Jay CA, Douglas V, Josephson SA, DeRisi JL, Chronic Meningitis Investigated via Metagenomic Next-Generation Sequencing. JAMA neurology 75, 947–955 (2018). [DOI] [PMC free article] [PubMed] [Google Scholar]
- 53.Kuhle J, Barro C, Andreasson U, Derfuss T, Lindberg R, Sandelius Å, Liman V, Norgren N, Blennow K, Zetterberg H, Comparison of three analytical platforms for quantification of the neurofilament light chain in blood samples: ELISA, electrochemiluminescence immunoassay and Simoa. Clinical chemistry and laboratory medicine 54, 1655–1661 (2016). [DOI] [PubMed] [Google Scholar]
- 54.Schirmer L, Srivastava R, Kalluri SR, Böttinger S, Herwerth M, Carassiti D, Srivastava B, Gempt J, Schlegel J, Kuhlmann T, Korn T, Reynolds R, Hemmer B, Differential loss of KIR4.1 immunoreactivity in multiple sclerosis lesions. Annals of neurology 75, 810–828 (2014). [DOI] [PubMed] [Google Scholar]
- 55.Forsberg K, Graffmo K, Pakkenberg B, Weber M, Nielsen M, Marklund S, Brännström T, Andersen PM, Misfolded SOD1 inclusions in patients with mutations in C9orf72 and other ALS/FTD-associated genes. Journal of Neurology, Neurosurgery & Psychiatry 90, 861–869 (2019). [DOI] [PMC free article] [PubMed] [Google Scholar]
- 56.Fujimura KE, Sitarik AR, Havstad S, Lin DL, Levan S, Fadrosh D, Panzer AR, LaMere B, Rackaityte E, Lukacs NW, Wegienka G, Boushey HA, Ownby DR, Zoratti EM, Levin AM, Johnson CC, Lynch SV, Neonatal gut microbiota associates with childhood multisensitized atopy and T cell differentiation. Nature medicine 22, 1187–1191 (2016). [DOI] [PMC free article] [PubMed] [Google Scholar]
- 57.Magoč T, Salzberg SL, FLASH: fast length adjustment of short reads to improve genome assemblies. Bioinformatics (Oxford, England) 27, 2957–2963 (2011). [DOI] [PMC free article] [PubMed] [Google Scholar]
- 58.Caporaso JG, Kuczynski J, Stombaugh J, Bittinger K, Bushman FD, Costello EK, Fierer N, Peña AG, Goodrich JK, Gordon JI, Huttley GA, Kelley ST, Knights D, Koenig JE, Ley RE, Lozupone CA, McDonald D, Muegge BD, Pirrung M, Reeder J, Sevinsky JR, Turnbaugh PJ, Walters WA, Widmann J, Yatsunenko T, Zaneveld J, Knight R, QIIME allows analysis of high-throughput community sequencing data. Nature methods 7, 335–336 (2010). [DOI] [PMC free article] [PubMed] [Google Scholar]
- 59.Edgar RC, Flyvbjerg H, Error filtering, pair assembly and error correction for next-generation sequencing reads. Bioinformatics (Oxford, England) 31, 3476–3482 (2015). [DOI] [PubMed] [Google Scholar]
- 60.Love MI, Huber W, Anders S, Moderated estimation of fold change and dispersion for RNA-seq data with DESeq2. Genome biology 15, 550 (2014). [DOI] [PMC free article] [PubMed] [Google Scholar]
- 61.Langille MGI, Zaneveld J, Caporaso JG, McDonald D, Knights D, Reyes JA, Clemente JC, Burkepile DE, Vega Thurber RL, Knight R, Beiko RG, Huttenhower C, Predictive functional profiling of microbial communities using 16S rRNA marker gene sequences. Nature biotechnology 31, 814–821 (2013). [DOI] [PMC free article] [PubMed] [Google Scholar]
- 62.Schmidt P, Gaser C, Arsic M, Buck D, Forschler A, Berthele A, Hoshi M, Ilg R, Schmid VJ, Zimmer C, Hemmer B, Muhlau M, An automated tool for detection of FLAIR-hyperintense white-matter lesions in Multiple Sclerosis. Neuroimage 59, 3774–3783 (2012). [DOI] [PubMed] [Google Scholar]
- 63.Eggers EL, Michel BA, Wu H, Wang S-Z, Bevan CJ, Abounasr A, Pierson NS, Bischof A, Kazer M, Leitner E, Greenfield AL, Demuth S, Wilson MR, Henry RG, Cree BA, Hauser SL, von Büdingen H-C, Clonal relationships of CSF B cells in treatment-naive multiple sclerosis patients. JCI insight 2, 1667 (2017). [DOI] [PMC free article] [PubMed] [Google Scholar]
- 64.Turchaninova MA, Davydov A, Britanova OV, Shugay M, Bikos V, Egorov ES, Kirgizova VI, Merzlyak EM, Staroverov DB, Bolotin DA, Mamedov IZ, Izraelson M, Logacheva MD, Kladova O, Plevova K, Pospisilova S, Chudakov DM, High-quality full-length immunoglobulin profiling with unique molecular barcoding. Nature protocols 11, 1599–1616 (2016). [DOI] [PubMed] [Google Scholar]
- 65.Bolotin DA, Poslavsky S, Mitrophanov I, Shugay M, Mamedov IZ, Putintseva EV, Chudakov DM, MiXCR: software for comprehensive adaptive immunity profiling. Nature methods 12, 380–381 (2015). [DOI] [PubMed] [Google Scholar]
- 66.Shannon P, Markiel A, Ozier O, Baliga NS, Wang JT, Ramage D, Amin N, Schwikowski B, Ideker T, Cytoscape: a software environment for integrated models of biomolecular interaction networks. Genome research 13, 2498–2504 (2003). [DOI] [PMC free article] [PubMed] [Google Scholar]
- 67.Ye J, Ma N, Madden TL, Ostell JM, IgBLAST: an immunoglobulin variable domain sequence analysis tool. Nucleic acids research 41, W34–40 (2013). [DOI] [PMC free article] [PubMed] [Google Scholar]
- 68.Bisanz JE, Soto-Perez P, Noecker C, Aksenov AA, Lam KN, Kenney GE, Bess EN, Haiser HJ, Kyaw TS, Yu FB, Rekdal VM, Ha CWY, Devkota S, Balskus EP, Dorrestein PC, Allen-Vercoe E, Turnbaugh PJ, A Genomic Toolkit for the Mechanistic Dissection of Intractable Human Gut Bacteria. Cell Host Microbe 27, 1001–1013 e1009 (2020). [DOI] [PMC free article] [PubMed] [Google Scholar]
- 69.Probstel AK, Dornmair K, Bittner R, Sperl P, Jenne D, Magalhaes S, Villalobos A, Breithaupt C, Weissert R, Jacob U, Krumbholz M, Kuempfel T, Blaschek A, Stark W, Gartner J, Pohl D, Rostasy K, Weber F, Forne I, Khademi M, Olsson T, Brilot F, Tantsis E, Dale RC, Wekerle H, Hohlfeld R, Banwell B, Bar-Or A, Meinl E, Derfuss T, Antibodies to MOG are transient in childhood acute disseminated encephalomyelitis. Neurology 77, 580–588 (2011). [DOI] [PubMed] [Google Scholar]
- 70.Pröbstel A-K, Rudolf G, Dornmair K, Collongues N, Chanson J-B, Sanderson NS, Lindberg RL, Kappos L, De Sèze J, Derfuss T, Anti-MOG antibodies are present in a subgroup of patients with a neuromyelitis optica phenotype. Journal of neuroinflammation 12, 46 (2015). [DOI] [PMC free article] [PubMed] [Google Scholar]
- 71.Broecker F, Seeberger PH, Synthetic Glycan Microarrays. Methods in molecular biology (Clifton, N.J.) 1518, 227–240 (2017). [DOI] [PubMed] [Google Scholar]
- 72.Martz SL, Guzman-Rodriguez M, He S-M, Noordhof C, Hurlbut DJ, Gloor GB, Carlucci C, Weese S, Allen-Vercoe E, Sun J, Claud EC, Petrof EO, A human gut ecosystem protects against C. difficile disease by targeting TcdA. Journal of gastroenterology 52, 452–465 (2017). [DOI] [PMC free article] [PubMed] [Google Scholar]
Associated Data
This section collects any data citations, data availability statements, or supplementary materials included in this article.