
Figure 2.
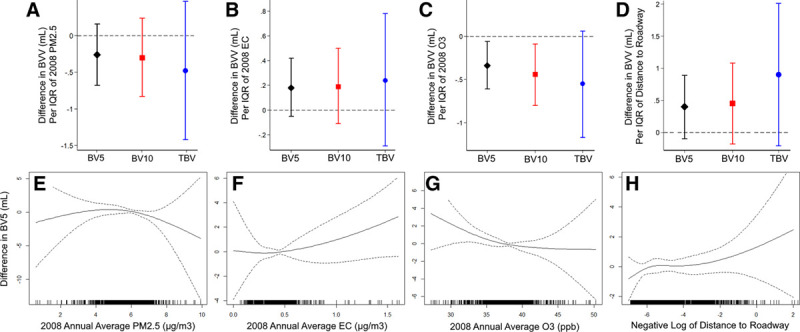
Associations of PM2.5, elemental carbon, ozone (2008 Annual Averages), and distance to roadway with pulmonary vessel volumes on CTa. Upper panes demonstrate difference in BVV (BV5, BV10, and TBV) by IQR of PM2.5 (A), elemental carbon (B), ozone (C), and distance to roadway (D). Lower panes demonstrate difference in BV5b by PM2.5 (E), elemental carbon (F), ozone (G), and distance to roadway (H). aAll results from models adjusted for age at time of CT, sex, height, weight, smoking status, total pack-years of cigarette exposure, second-hand tobacco exposure during adulthood, personal educational attainment, occupation category, median value of owner-occupied housing, study cohort, date of CT and sine and cosine day of the year terms (to account for seasonality and time), any history of cardiovascular disease, and FEV1. Distance to Roadway is defined as the negative natural log of distance to roadway (with higher values therefore indicating greater traffic-related pollution exposure), and those living ≥1 km from a major road were excluded. Results expressed per IQR of exposure. bPenalized splines demonstrating difference in BV5 as a function of air pollutant exposure. Data were fitted using a penalized spline with 3 degrees of freedom. The solid line represents adjusted difference in BV5 and the dashed lines indicate the 95% confidence interval bands. The distribution of the exposure is displayed by the rug plot along the x axis. BVV indicates blood vessel volumes; CT, computed tomography; IQR, interquartile range.