Figure 2.

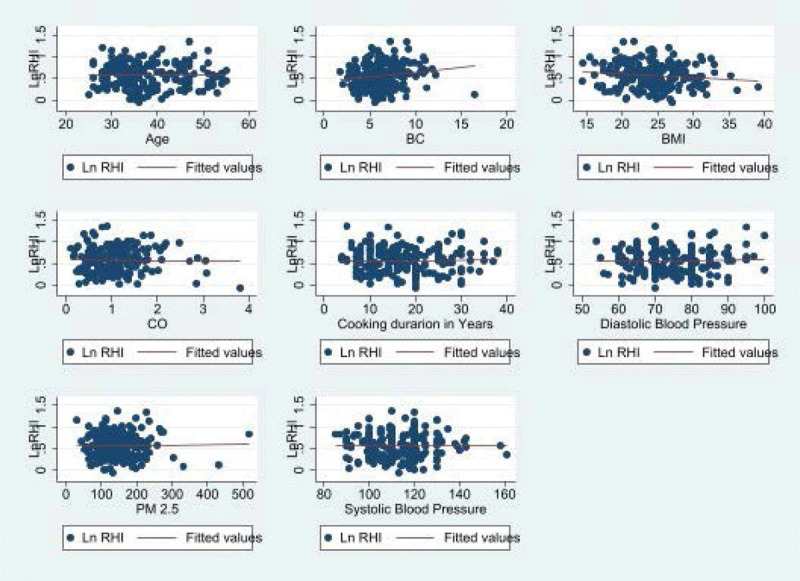
Scatter plot showing association between RHI and age, BMI, cooking duration (hours/day), DBP, SBP, and years of HAP use.

Scatter plot showing association between RHI and age, BMI, cooking duration (hours/day), DBP, SBP, and years of HAP use.