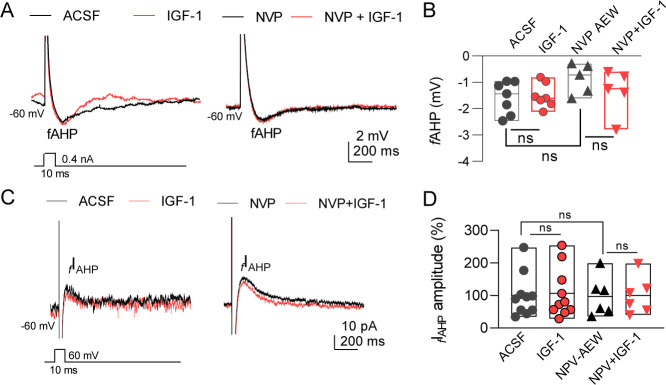
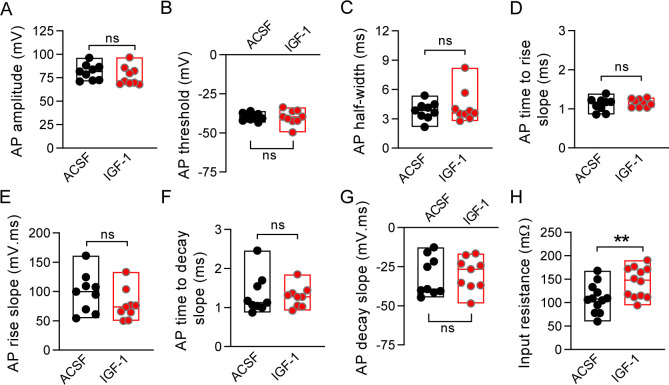
Figure 1. IGF-1 increases the excitability of IL-L5PNs.
(A) Representative recordings from IL-L5PNs of hyperpolarizing potentials elicited by an 800 ms depolarizing pulse to study medium and slow AHP in control conditions (ACSF, top) and in the presence of NVP-AEW541 (40 nM, bottom), before (black) and during IGF-1 (10 nM, red) (spikes are truncated). The mAHP was measured at the hyperpolarization peak and the gray box indicates where the sAHP was measured. (B) Bar diagram summarizing mAHP amplitudes (n = 9 cells/8 animals; ACSF vs IGF-1 **p<0.01 and ns (non-significant) n = 6 cells/3 animals NVP vs NVP +IGF-1, Student's paired t-test). Mann–Whitney test, n = 9/6 cells ACSF vs NVP, ns. (C) Bar diagram summarizing sAHP amplitudes (n = 9 cells/8 animals; ACSF vs IGF-1 **p<0.01 and ns n = 6 cells/3 animals NVP vs NVP +IGF-1, Student's paired t-test). Mann–Whitney test, n = 9/6 cells ACSF vs NVP, ns. (D). Representative traces recorded from IL-L5PNs after 100 pA current injection in ACSF (gray) and after IGF-1 application (red). (E) Plot showing the frequency of APs as a function of the injected current (pA) for IL-L5PNs in ACSF (gray) and after IGF-1 application (red) (n = 10 cells/8 animals ACSF vs IGF-1 *p<0.05, **p<0.01 and ns, Multiple t-tests with post hoc Holm–Sildak multiple comparison methods). See also Figure 1—figure supplement 1 and Figure 1—figure supplement 2.


