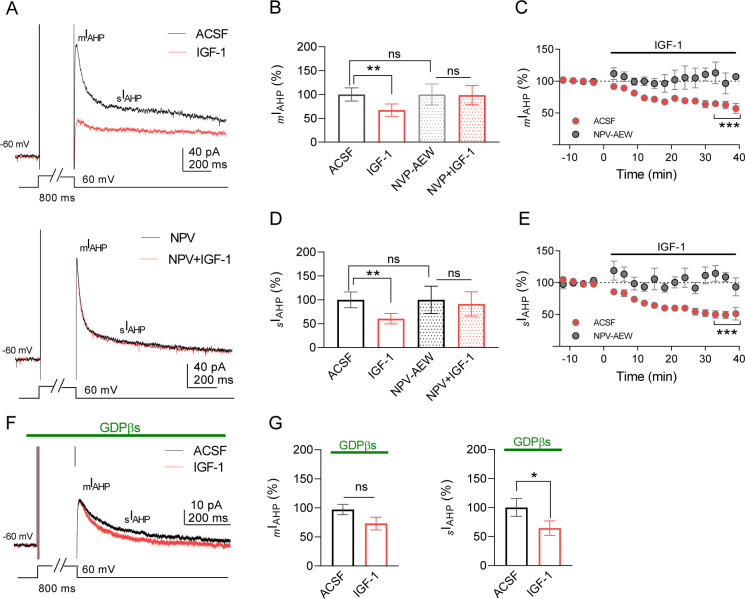
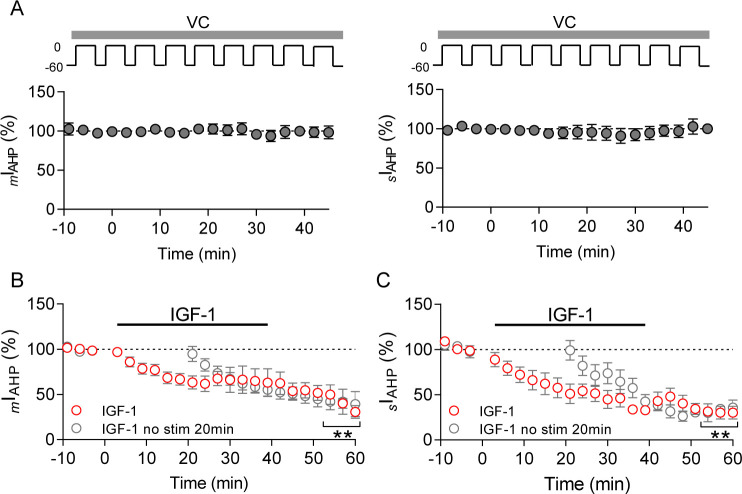
Figure 2. IGF-1 reduces mIAHP and sIAHP in IL-L5PNs.
(A) Representative current traces recorded from IL-L5PNs in response to an 800 ms depolarizing voltage pulse from −60 mV to 0 mV in the control condition (ACSF, top) and the presence of NVP-AEW541 (40 nM, bottom), before (black), and during 10 nM IGF-1 (red). (B) Bar diagram summarizing the normalized amplitude of mIAHP (n = 9 cells/5 animals; ACSF vs IGF-1 **p<0.01 and ns, non-significant, n = 7 cells/7 animals NVP vs NVP + IGF-1, Student's paired t-test). Mann–Whitney test, n = 9/7 cells ACSF vs NVP, ns. (C) Plot showing the time course of the peak amplitude of the mIAHP in ACSF (red) and in NVP-AEW541 before and during IGF-1 (n = 9 cells/7 animals; ACSF vs IGF-1 ***p<0.0001 and ns n = 7 cells/7 animals NVP vs NVP + IGF-1, Student's paired t-test). Mann–Whitney test, n = 9/7 cells IGF-1 vs NVP + IGF-1, ns. (D and E) Same as B and C respectively but for the sIAHP. (F) Same as A, but in the presence of GDPβs in the patch pipette. Note that only the sIAHP is modulated by IGF-1 under blockade of the G proteins. (G) Bar diagram summarizing the normalized amplitude of mIAHP (left) and normalized area of sIAHP (right) under GDPβs (n = 8 cells/4 animals; mIAHP ACSF vs IGF-1 ns, non-significant and sIAHP, n = 8 cells/4 animals ACSF vs IGF-1 *p<0.05, Student's paired t-test). See also Figure 2—figure supplement 1.


