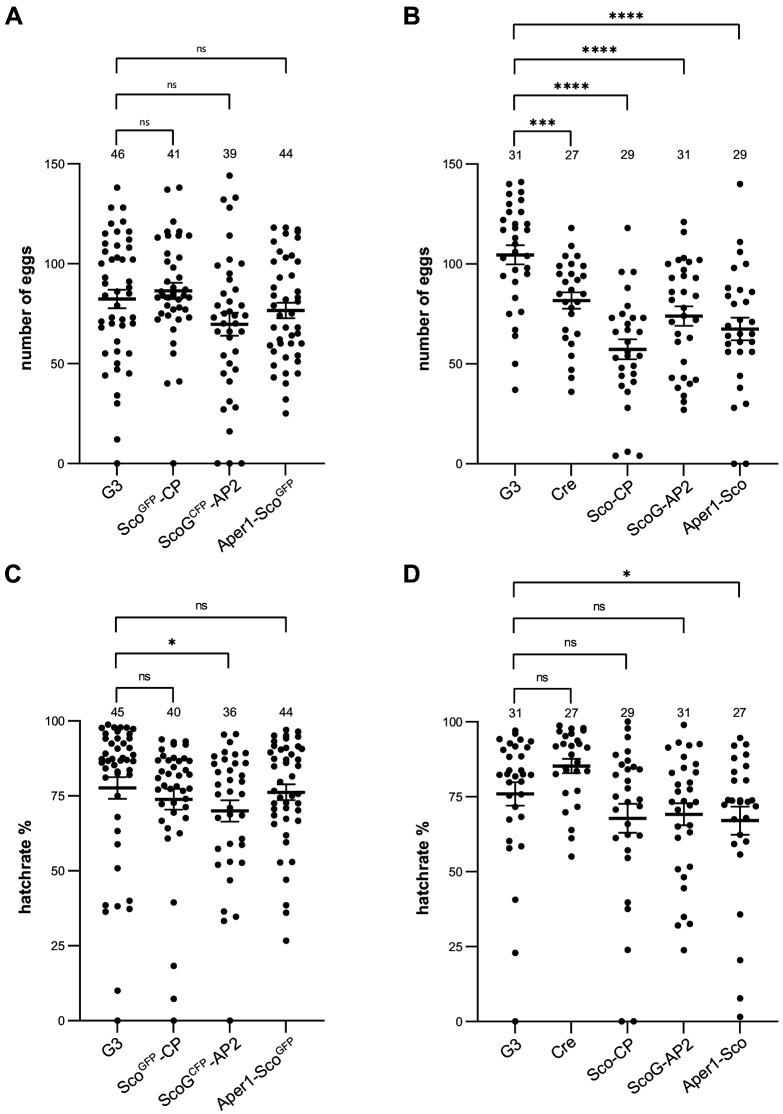
Figure 4. Fecundity and larval hatch rates of the transgenic strains.
Fecundity of single females of the homozygous strains ScoGFP-CP, ScoGCFP-AP2, and Aper1-ScoGFP(A) and the markerless strains Sco-CP, ScoG-AP2, and Aper1-Sco (B) compared to the G3 wild-type and the vasa-Cre strain (KIL background) used to remove the marker module. All data sets have a Gaussian distribution according to the Shapiro–Wilk test, except of ScoGFP-CP. p-values were calculated using the unpaired two-tailed Student’s t-test. Larval hatch rates of the transgenic strains with (C) and without (D) the marker, as well as the control strains, from the eggs above. None of the data sets showed a Gaussian distribution according to Shapiro–Wilk, and the p-values were calculated using the Kolmogorov–Smirnov test. Data from three biological replicates were pooled and the total number analysed is indicated on top. Mean with standard error (SEM) were plotted. *p≤0.05, **p≤0.01, ***p≤0.001, ****p≤0.0001, and ns: not significant.
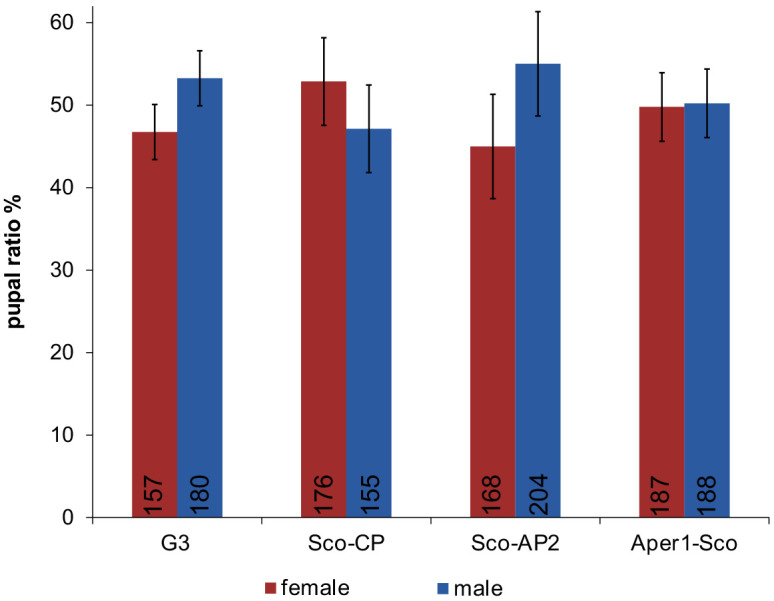
Figure 4—figure supplement 1. Pupal sex ratio.


