. 2021 Mar 4;10:e62678. doi: 10.7554/eLife.62678

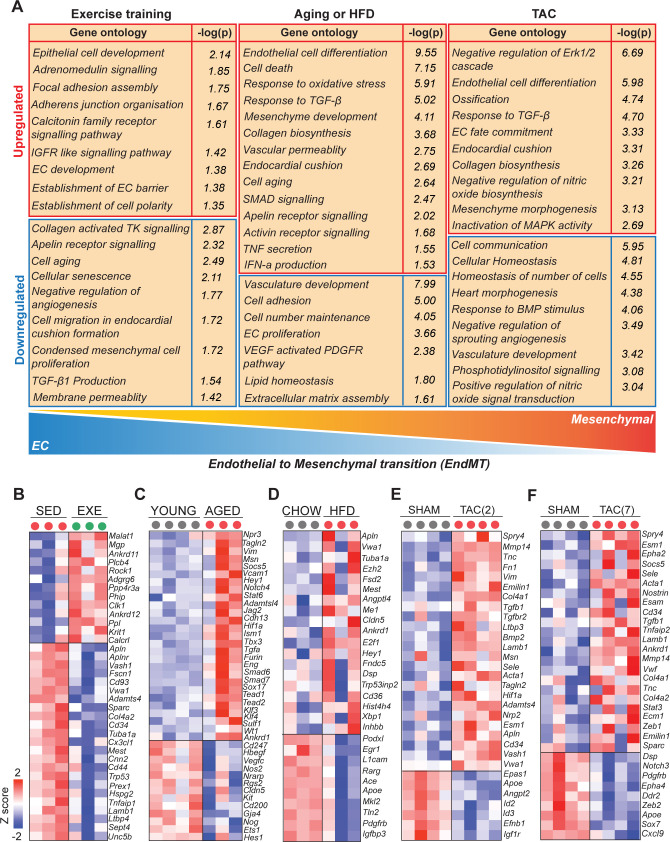
Figure 3. Cardiovascular disease (CVD) risk factors activate mesenchymal gene expression in cardiac endothelial cells (ECs).

(A) Gene ontology analysis of the up- and downregulated genes. Note the opposite changes induced by exercise training compared to the CVD risk factors. (B–F) Heatmaps showing the differential gene expression of endothelial and mesenchymal genes previously associated with endothelial-to-mesenchymal transition (EndMT). Genes are selected based on published data sets (references are found in Figure 3—source data 1). In all panels, the up- and downregulated genes with the false discovery rate (FDR; Benjamini–Hochberg adjusted p-value) threshold of 0.05 were considered. In the heatmap, each color-coded circle (red, green, and black) indicates an individual biological sample within each experimental group. N = 3–4 male mice/group.

Figure 3—source data 1. Genes and reference list for endothelial and mesenchymal genes indicated in the Figure 3B–F heat map.
(A) Reference list for endothelial and mesenchymal genes indicated in the Figure 3B (EXE vs. SED) heat map. (B) Reference list for endothelial and mesenchymal genes indicated in the Figure 3C (aged vs. young) heat map. (C) Reference list for endothelial and mesenchymal genes indicated in the Figure 3D (high-fat diet [HFD] vs. Chow) heat map. (D) Reference list for endothelial and mesenchymal genes indicated in the Figure 3E (transverse aortic constriction [TAC] [2] vs. Sham) heat map. (E) Reference list for endothelial and mesenchymal genes indicated in the Figure F (TAC [7] vs. Sham) heat map.
elife-62678-fig3-data1.docx (192.6KB, docx)
Figure 3—source data 2. Source data for Figure 3B, C, D, E and F.

Figure 3.

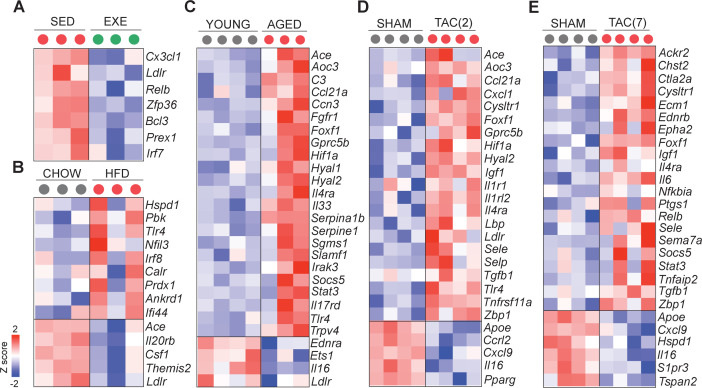
Figure 3—figure supplement 1. Cardiovascular disease (CVD) risk factors induce inflammatory gene expression in cardiac endothelial cells (ECs).

Figure 3—figure supplement 1.

(A–E) Expression of inflammatory genes in the cardiac ECs of the indicated experimental groups. Genes were identified by comparing our data set with the Gene ontology term: Inflammatory response (GO:0006954) described in the http://www.informatics.jax.org/vocab/gene_ontology/GO:0006954. In panel (A–E), the up- and downregulated genes with false discovery rate (FDR; Benjamini–Hochberg adjusted p-value) threshold of 0.05 were considered. In the heatmap, each color-coded circle (red, green, and black) indicates the gene expression data obtained from individual biological sample per experimental group. N = 3–4 male mice per group were analyzed.
Figure 3—figure supplement 1—source data 1. Source data for Figure 3—figure supplement 1A, B, C, D and E.
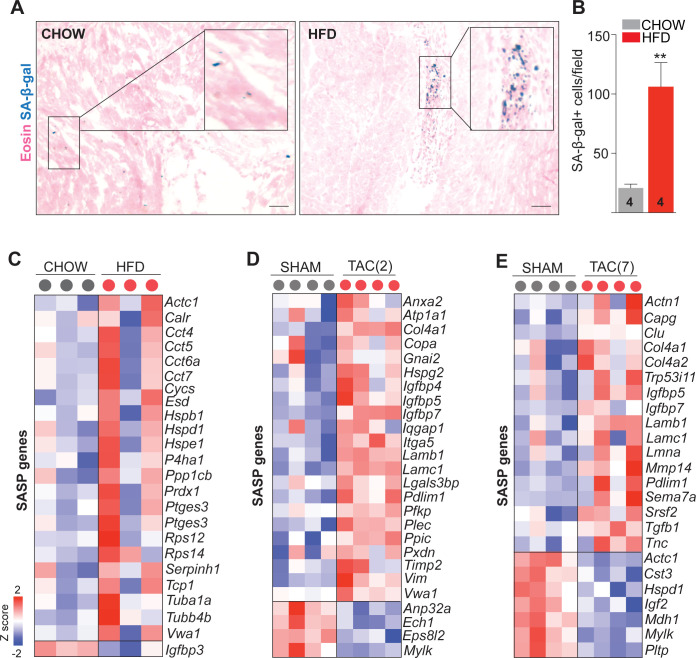
Figure 3—figure supplement 2. Obesity and pressure overload induce SASP gene expression and senescence in the heart.

Figure 3—figure supplement 2.

(A and B) Representative images and quantification of the SA-β-galactosidase staining (in blue) detected at pH 6.0 in the high-fat diet and chow diet fed mouse hearts. (C–E) Expression of senescence-associated secretory phenotype (SASP) genes in the cardiac endothelial cells (ECs) of the indicated experimental groups. Genes were identified by comparing our data set with the previously published data sets deposited in the following databases: SASP Atlas (http://www.saspatlas.com) and SenQuest (https://senequest.net), and the endothelial expression of the genes were verified using Tabula Muris. In panels C–E, the up- and downregulated genes with false discovery rate (FDR; Benjamini–Hochberg adjusted p-value) threshold of 0.05 were considered. In the heatmap, each color-coded circle (red, green, and black) indicates the gene expression data obtained from individual biological sample per experimental group. N = 3–4 male mice per group were analyzed. In panels A and B (N = 3–4 male mice per group), Scale bar 100 μm. Data is presented as mean ± SEM. Student’s t-test was used, *p<0.05, **p<0.01, ***p<0.001.
Figure 3—figure supplement 2—source data 1. Source data for Figure 3—figure supplement 2B, C, D and E.
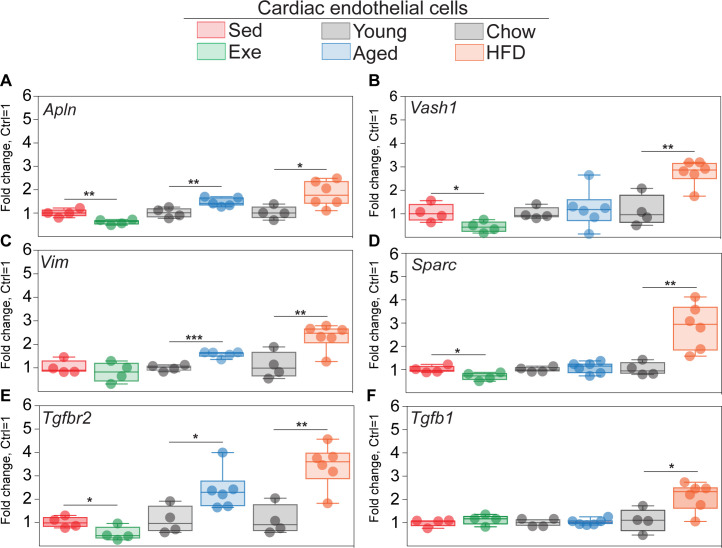
Figure 3—figure supplement 3. QPCR validation of selected genes in the cardiac endothelial cells (ECs) of aged, obese, and exercise trained mice.

Figure 3—figure supplement 3.

(A–F) mRNA expression of Apln, Vim, Tgfbr2, Vash1, Sparc, and Tgfb1 in the cardiac EC of the indicated experimental groups (N = 4–6 male mice/group). Gene expression is normalized to Hprt1 expression. Data is presented as mean ± SEM. Student’s t-test was used, *p<0.05, **p<0.01, ***p<0.001.
Figure 3—figure supplement 3—source data 1. Source data for Figure 3—figure supplement 3A, B, C, D, E and F.