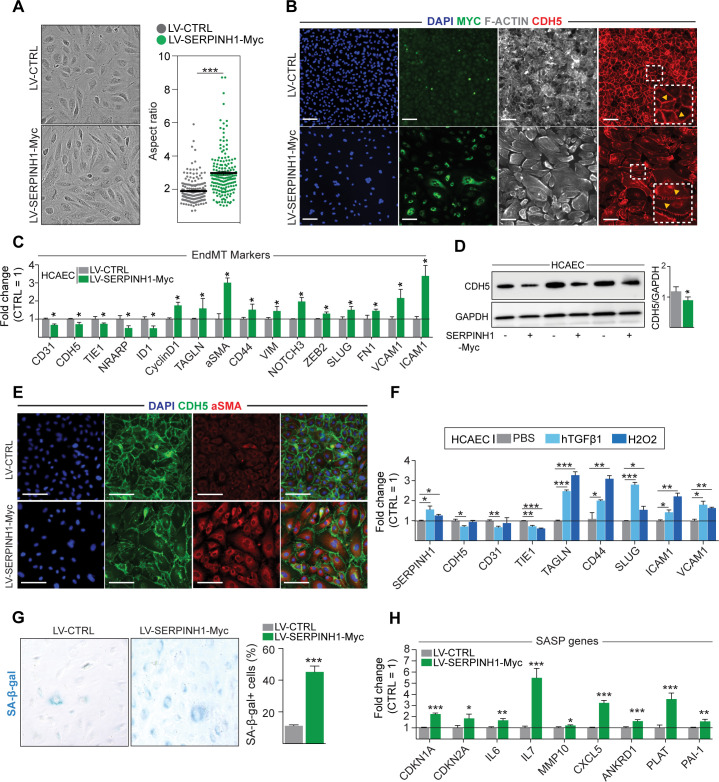
Figure 5. Overexpression of SERPINH1 modifies the endothelial cell (EC) phenotype and induces mesenchymal gene expression in human cardiac ECs.
(A) Representative phase-contrast images of live human cardiac arterial EC (HCAEC) transduced with LV-CTRL and LV-SERPINH1-Myc, and quantification of the aspect ratio (length to width ratio) of the cell. (B) Representative immunofluorescent images showing the expression of Myc-tagged SERPINH1 in green, F-Actin in gray, and CDH5/VE-Cadherin in red. The inset within the white box shows magnified view of VE-Cadherin junctions in HCAECs. (C) qPCR analysis of endothelial and mesenchymal markers in SERPINH1 overexpressing cells. (D) Western blot analysis and quantification of CDH5/VE-cadherin expression in the SERPINH1 overexpressing HCAECs (normalized to GAPDH). (E) Representative immunofluorescent images showing DAPI in blue, CDH5/VE-Cadherin in green, and α-smooth muscle actin (aSMA) in red. (F) qPCR analysis of SERPINH1 and EndMT markers in HCAECs stimulated with TGF-β1 (50 ng/ml) or H2O2 for 5 days. (G) Representative images and quantification of SA-β-gal+ senescent cells (in blue) normalized to total nuclei (%) in SERPINH1 overexpressing and control cells. (H) qPCR analysis of senescence-associated secretory phenotype (SASP) genes in HCAECs transduced with LV-CTRL and LV-SERPINH1-Myc. In panels A, C, D, F, G, and H, N = 3 biological replicates/group were analyzed. Scale bar 100 μm. Data is presented as mean ± SEM. Student’s t-test was used, *p<0.05, **p<0.01, ***p<0.001.
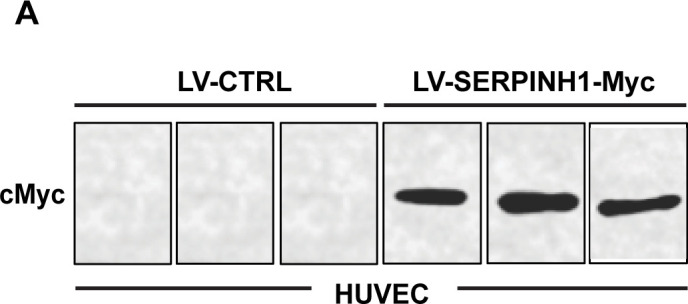
Figure 5—figure supplement 1. SERPINH1 overexpression in endothelial cells.


