
Figure 4.
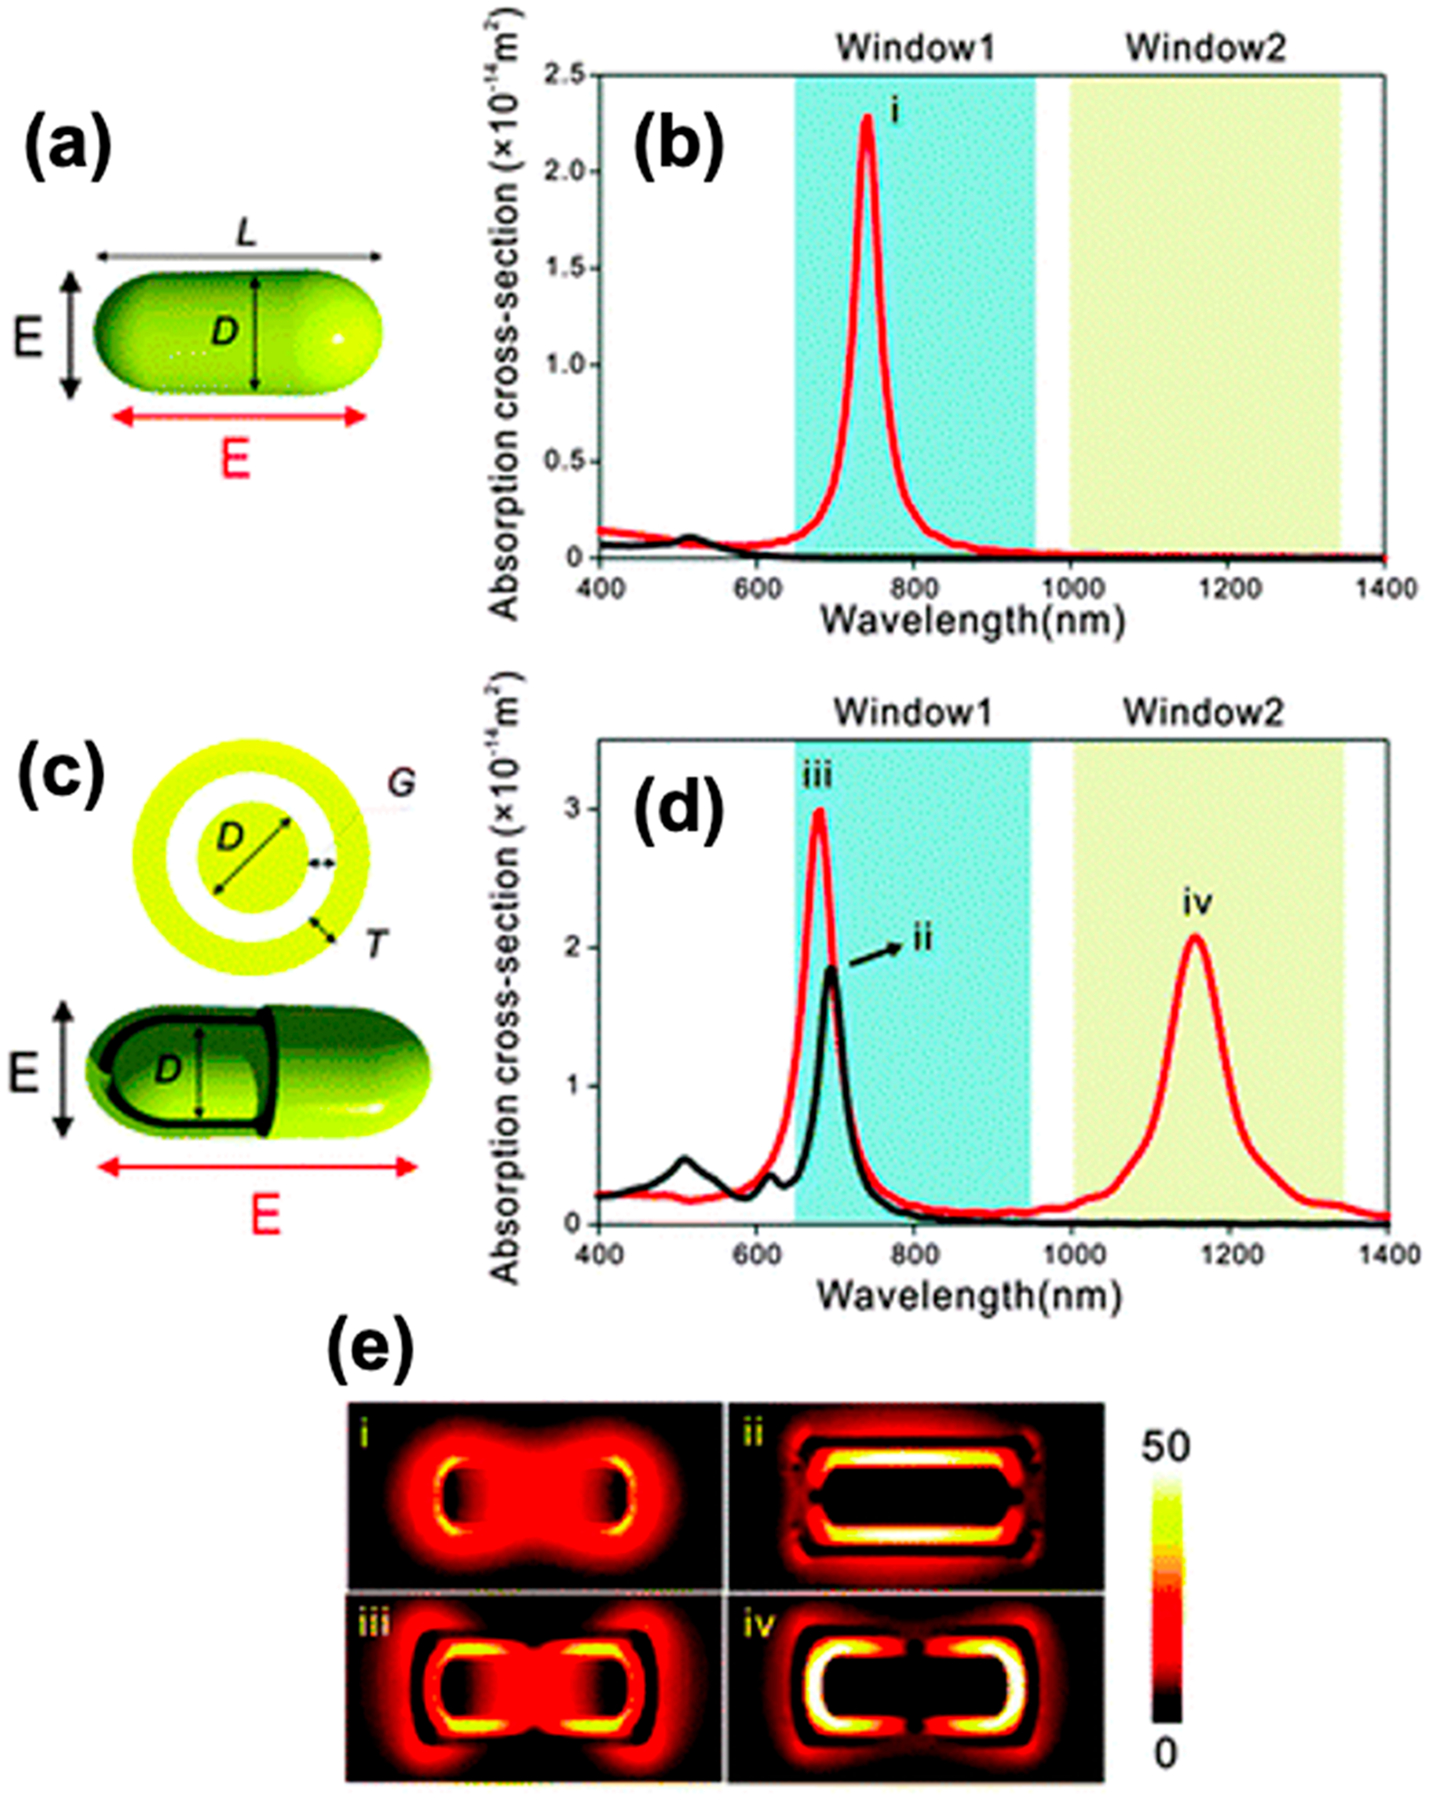
Moving plasmonics into the NIR-II window. (a,c) Schematic illustrations and (b,d) calculated absorption spectra of (a,d) a Au nanorod (D = 20 nm, L = 60 nm) or (c,d) a Au rod-in-shell particle (D = 20 nm, L = 60 nm, T = 4 nm, and G = 5 nm) when illuminated by the (black) transversely or (red) longitudinally polarized light. The blue and yellow shaded areas indicate the NIR-I and -II biological optical windows, respectively. (e) Near-field intensity distribution of the resonance modes (i–iv). Reprinted with permission from ref 91. Copyright 2014 The Royal Society of Chemistry.