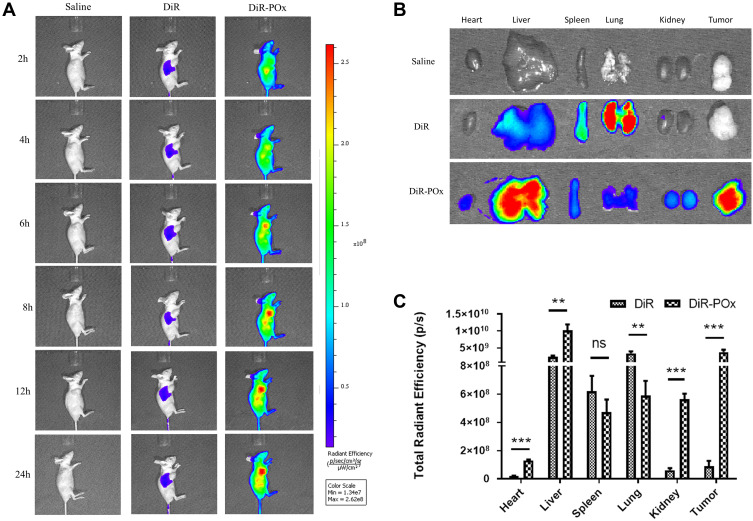
Figure 7.
The evaluation of the distribution of DiR loaded micelles in MCF-7 tumor-bearing nude mice after tail vein injection of the formulations. (A) Images taken at 2, 4, 6, 8, 12, 24h after administration of DiR and DiR loaded micelles, respectively. (B) Ex vivo fluorescence images of organs and tumors were collected at 24h post-injection of formulations. (C) Total fluorescence signals of the ex vivo organs and tumors uptake DiR by Imaging Software. Data are expressed as mean ± SD (n=3). ***p<0.001,**p<0.01, nsIndicates p>0.05.

