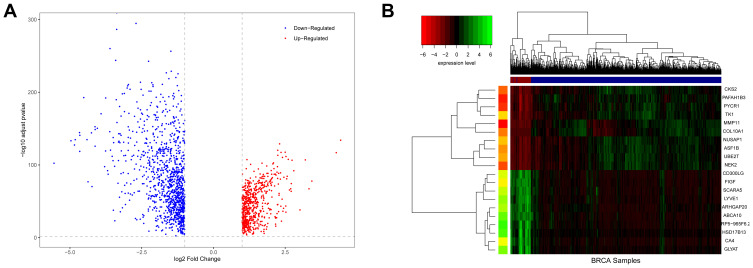
Figure 1.
Differences in BRCA expression. (A) is a volcano map of differentially expressed genes. (B) is a hierarchical clustering heat map of the top 20 significant differentially expressed genes. On the x-axis, dark blue represents tumor samples, and brown represents normal samples. The y-axis represents the top 20 differentially expressed genes.

