Figure 5.
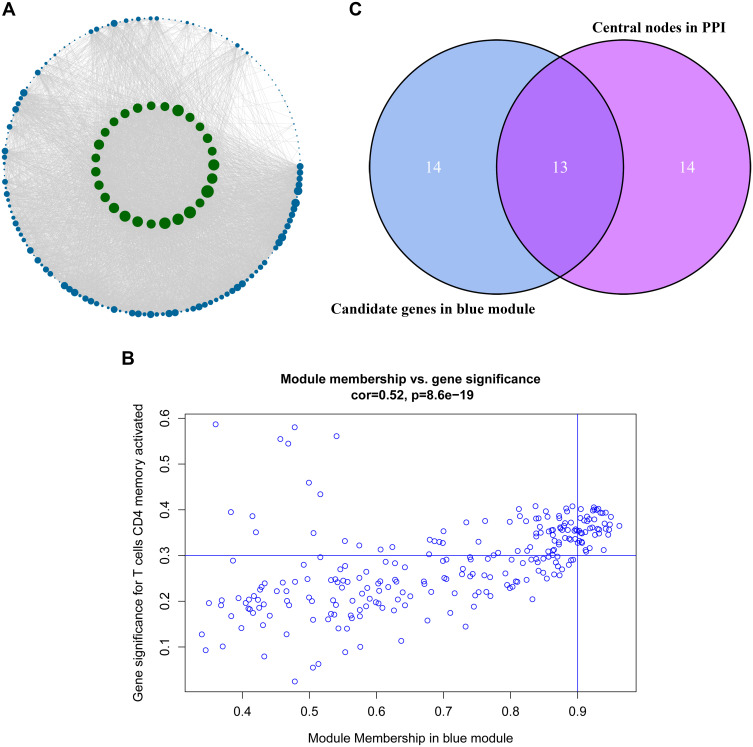
Identification of the hub genes. (A) is the protein–protein interaction (PPI) network from the blue modular gene. The greater the number of connected nodes, the larger the nodes. The green node represents the central node which is greater than 95 degrees. (B) is a scatter plot of blue modular genes. (C) is based on the genes whose PPI and co-expression network overlap and were selected as hub genes.

