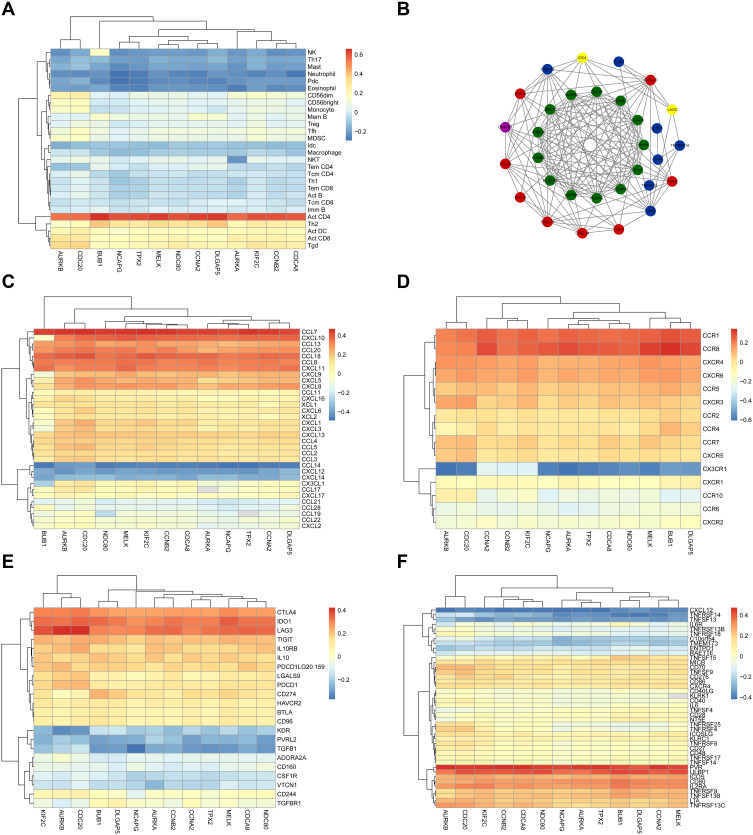
Figure 7.
Validation of the hub genes in Tumor and Immune System Interaction Database. (A) and (C–F) represent heat maps of the correlation between hub genes and immune cells, chemokines, receptors, immune-inhibitory factors, and immune-stimulatory factors, respectively. (B) shows the protein–protein interaction network of the immune microenvironment. Green represents hub genes, red represents chemokines, purple represents receptors, yellow represents immune-inhibitory factors, and blue represents immune-stimulatory factors.

