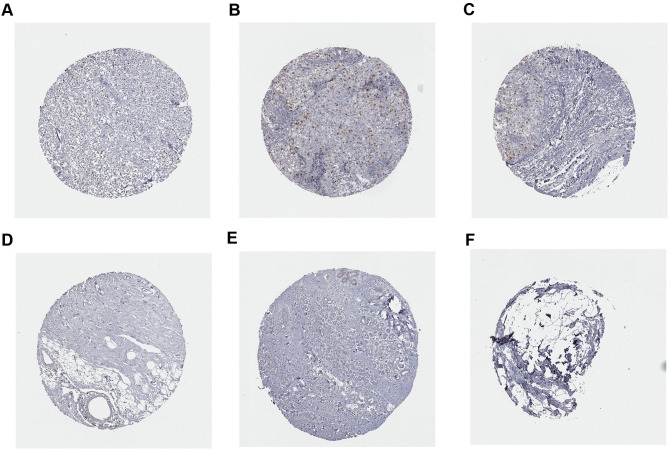
Figure 13.
Immunohistochemistry analysis of CCNA2 expression in breast cancer samples. Data were obtained from the human protein atlas. (A) Protein levels of CCNA2 in tumor tissue (staining: Low; intensity: week; quantity: <25%). (B and C) Protein levels of CCNA2 in tumor tissue (staining: Medium; intensity: strong; quantity: <25%). (D–F) Protein levels of CCNA2 in normal tissue (staining: not detected; intensity: negative; quantity: none).

