Fig. 7.
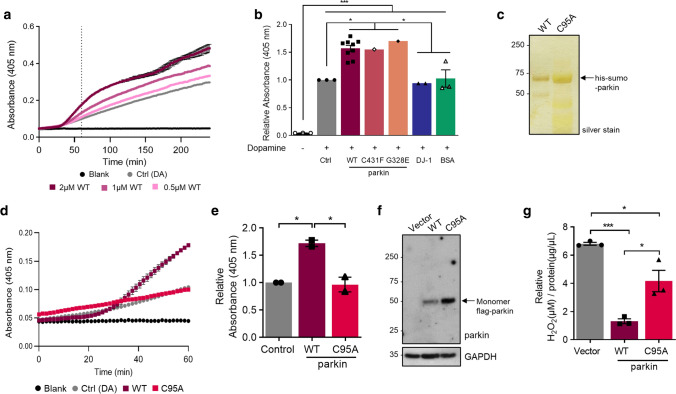
Parkin-dependent increase in melanin formation involves residue cysteine 95. a Kinetic curve of melanin production (read at absorbance 405 nm) over time in the absence of exogenous protein (dopamine (DA Ctrl) alone) vs. increasing molar concentrations of wild-type (WT), full-length human r-parkin shown for three concentrations (0.5, 1, 2 μm). Each condition was performed in triplicate. b Total melanin formation for indicated recombinant proteins at 60 min, as expressed relative to its production under dopamine only control (Ctrl) condition. Data represent the mean of triplicates ± SEM. ***p < 0.05 by 1-way ANOVA with Tukey’s post-hoc test [F(6,15) = 40.05, p < 0.0001]. c Silver gel for the analysis of His-SUMO-tagged, full-length, human r-parkin proteins of wild-type sequence and its variant carrying a p.C95A mutation. SDS/PAGE was performed under reducing conditions. d, e Representative kinetic curve for melanin production (d) and relative total melanin formation at 60 min (e), where production in the presence of wild-type (WT) or p.C95A mutant r-parkin (each, 2 μM) is shown relative to dopamine (DA) (Ctrl) alone. Data represent mean of n = 2, each performed in triplicate ± SEM. ***p < 0.05 by 1-way ANOVA with Tukey’s post-hoc test [F(2,3) = 24.96, p = 0.0135]. f, g Protein expression, as shown by Western blotting (f), and fold change in H2O2 levels (g) for dopamine-treated M17 cells -relative to vehicle-treated sister wells- that transiently express either flag-control, or WT vs. p.C95A-mutant human parkin-encoding cDNA plasmids. Results are shown as mean ± SEM (n = 3) and all dopamine-treated samples (200 μm dopamine) were normalized to their respective untreated samples. Anti-GAPDH immunoblotting served as a loading control (in f). A one-way ANOVA with Tukey’s post hoc test (*p < 0.05 and ***p < 0.001) was used for statistical analysis; [F (2, 6) = 36.86, p = 0.0004]

