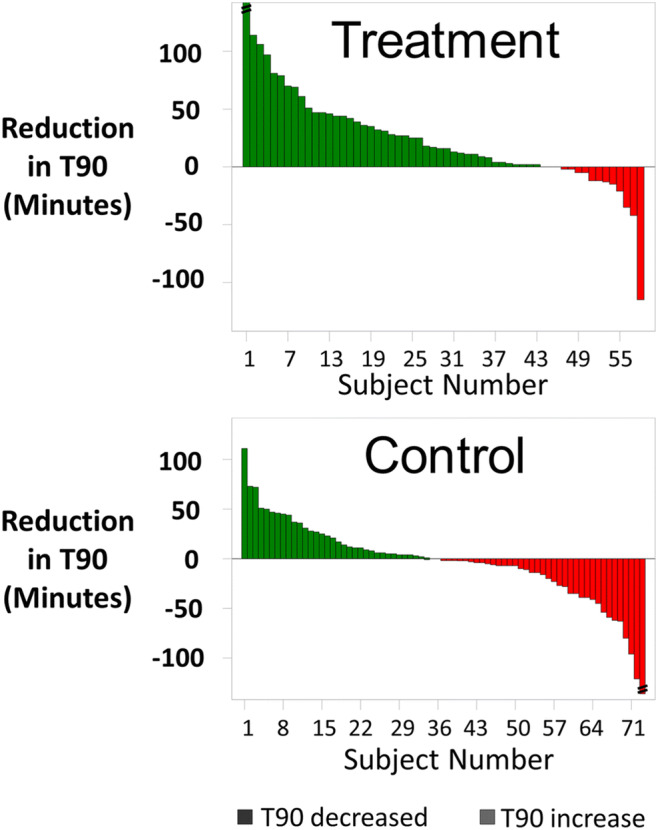
Fig. 4.

Oxygen saturation < 90% improvement from baseline to 6 months for each subject. Each vertical bar represents the reduction (improvement) in minutes of sleep with oxygen saturation < 90% from baseline to 6 months for a subject. The green bars (> 0%) represent reduction and red (< 0%) represent increase. Actual percentage increase for control subject results beyond the scale are noted at the bottom of the bars, Min = minutes; T90 = minutes of sleep with oxygen saturation < 90%
