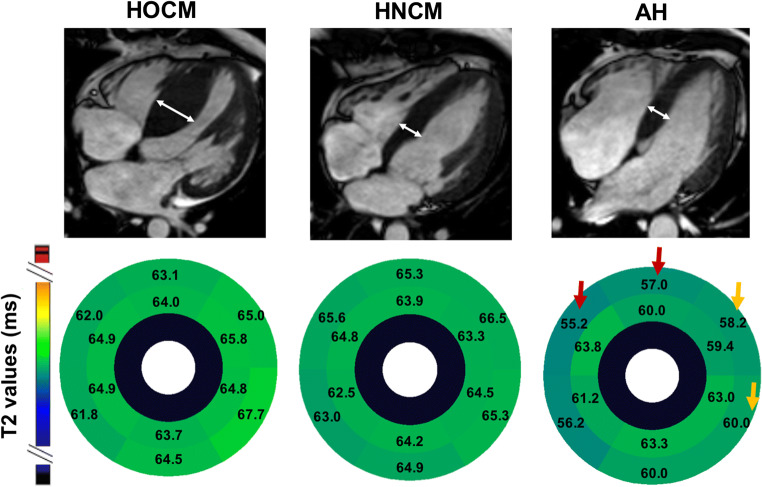
Fig. 2.
Segmental analysis of T2 values. Upper panel, end-diastolic 4-chamber cine view for the calculation of IVS (white double arrows). Lower panel, mean T2 value segmental analysis for patients with HOCM, HNCM, and AH. Red arrows indicate reduced T2 values compared with both entities of LVH, orange arrows to only HOCM. AH, athlete’s heart; HOCM, hypertrophic obstructive cardiomyopathy; HNCM, hypertrophic non-obstructive cardiomyopathy

