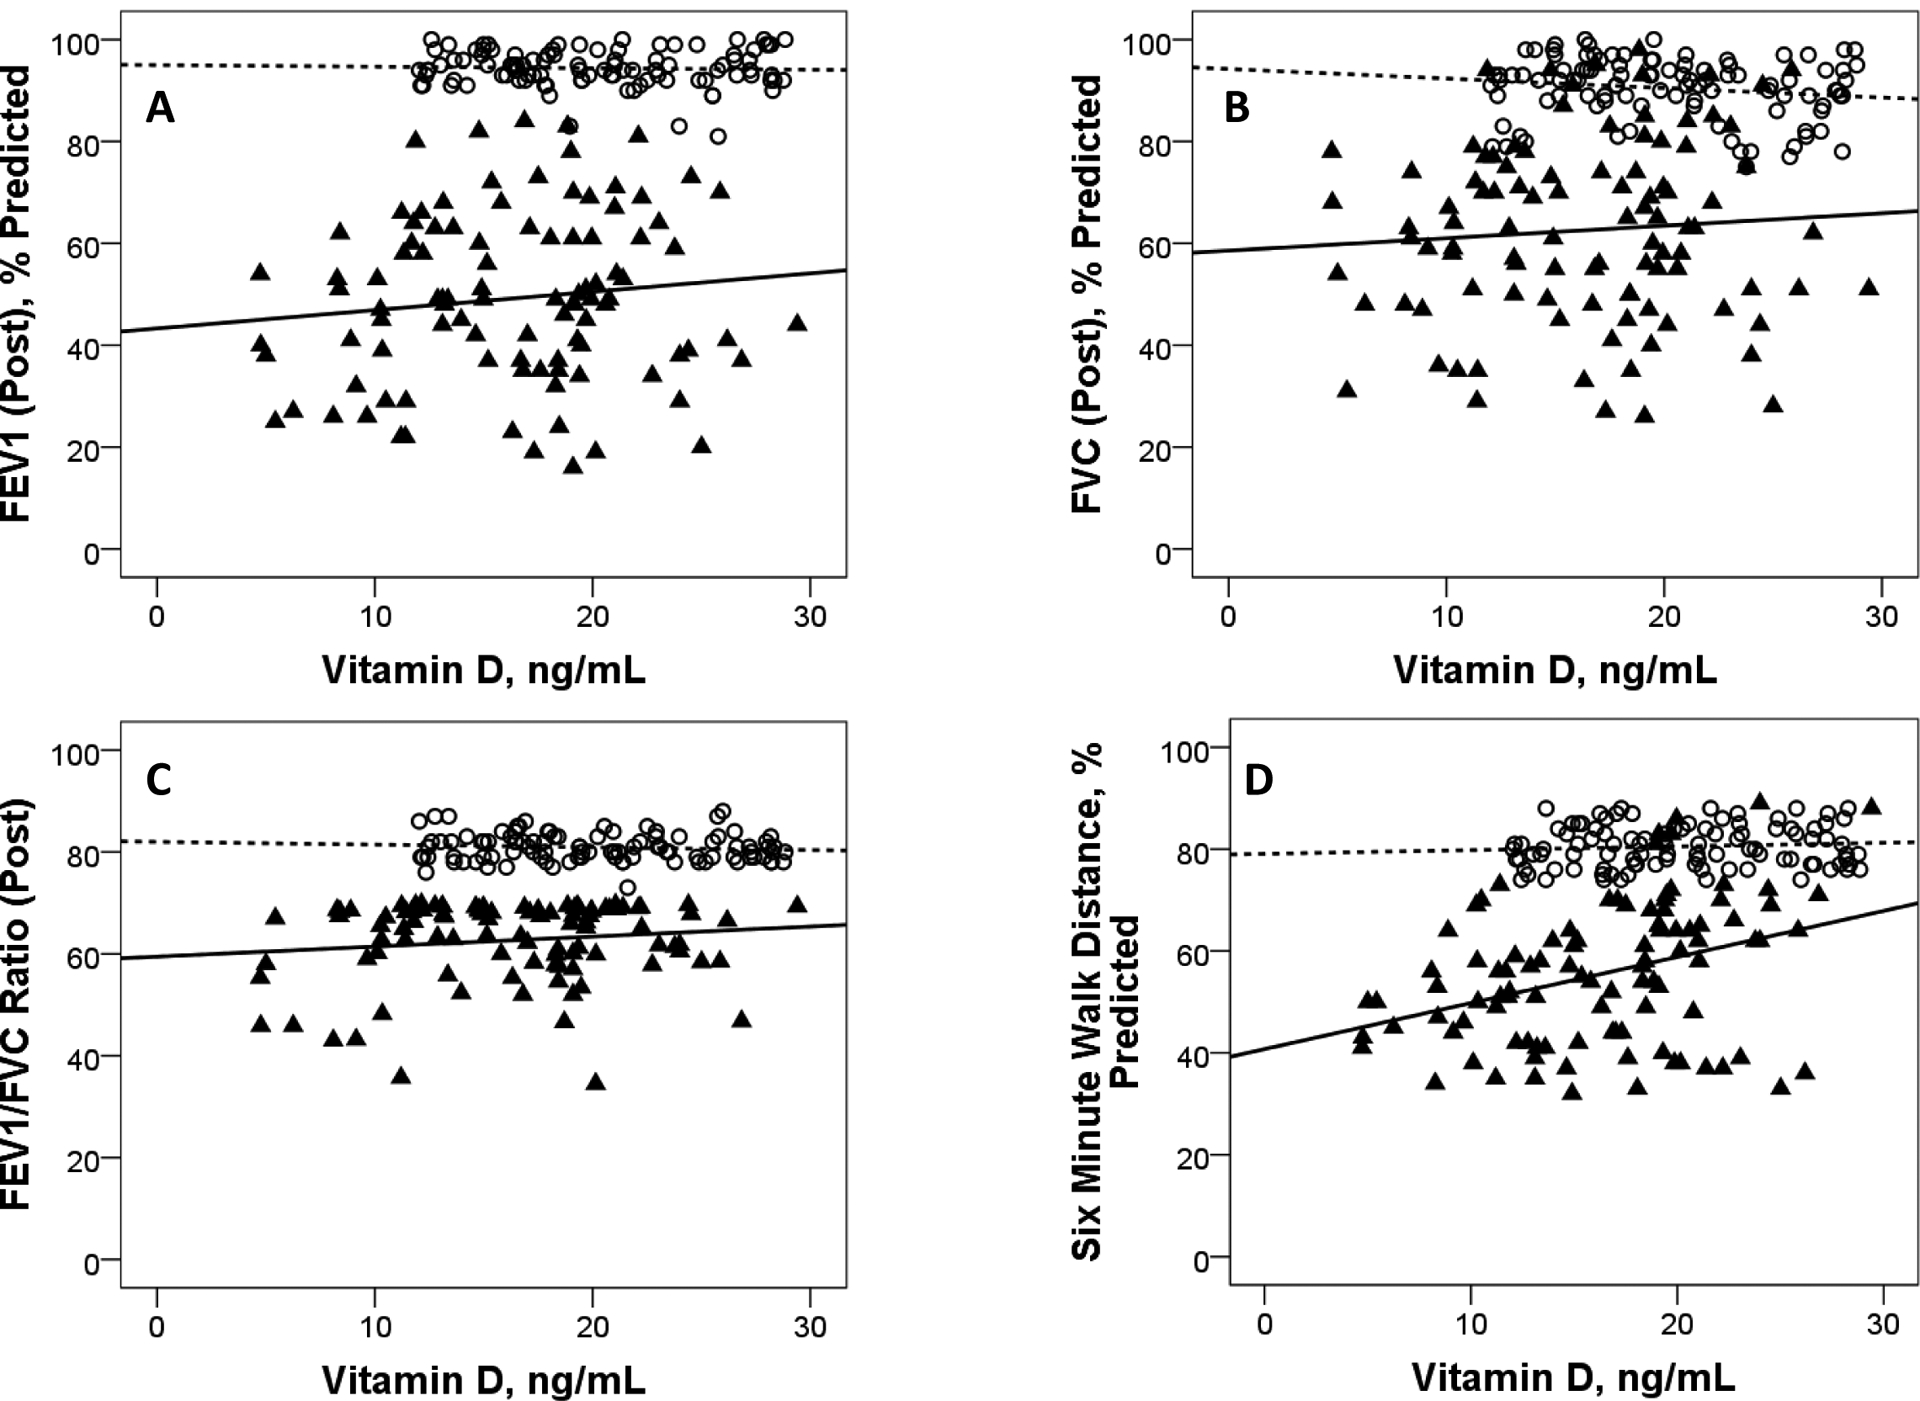
Figure 2:

Scatter plots showing (A) Forced Expiratory Volume in 1 second % Predicted (FEV1 %), (B)Forced Vital Capacity % Predicted (FVC %), (C) FEV1/FVC Ratio and (D) six minute walk distance % Predicted (SMWD%), plottedagainst levels of vitamin D for Non COPDand COPD subjects.
(Non COPDsubjects are denoted by⃝ symbol and dotted trend line. COPD subjects are denoted by▴symboland solid trend line. PlotA: Non COPD r-0.04, p0.68, COPDr0.12, p0.24; PlotB: Non COPD r-0.16, p0.12, COPDr0.8, p0.46; PlotC: Non COPD r-0.1, p0.32, COPDr0.14 p0.18; PlotD: Non COPD r0.09, p0.38, COPD r0.36, p<0.001).
