
Figure 4:
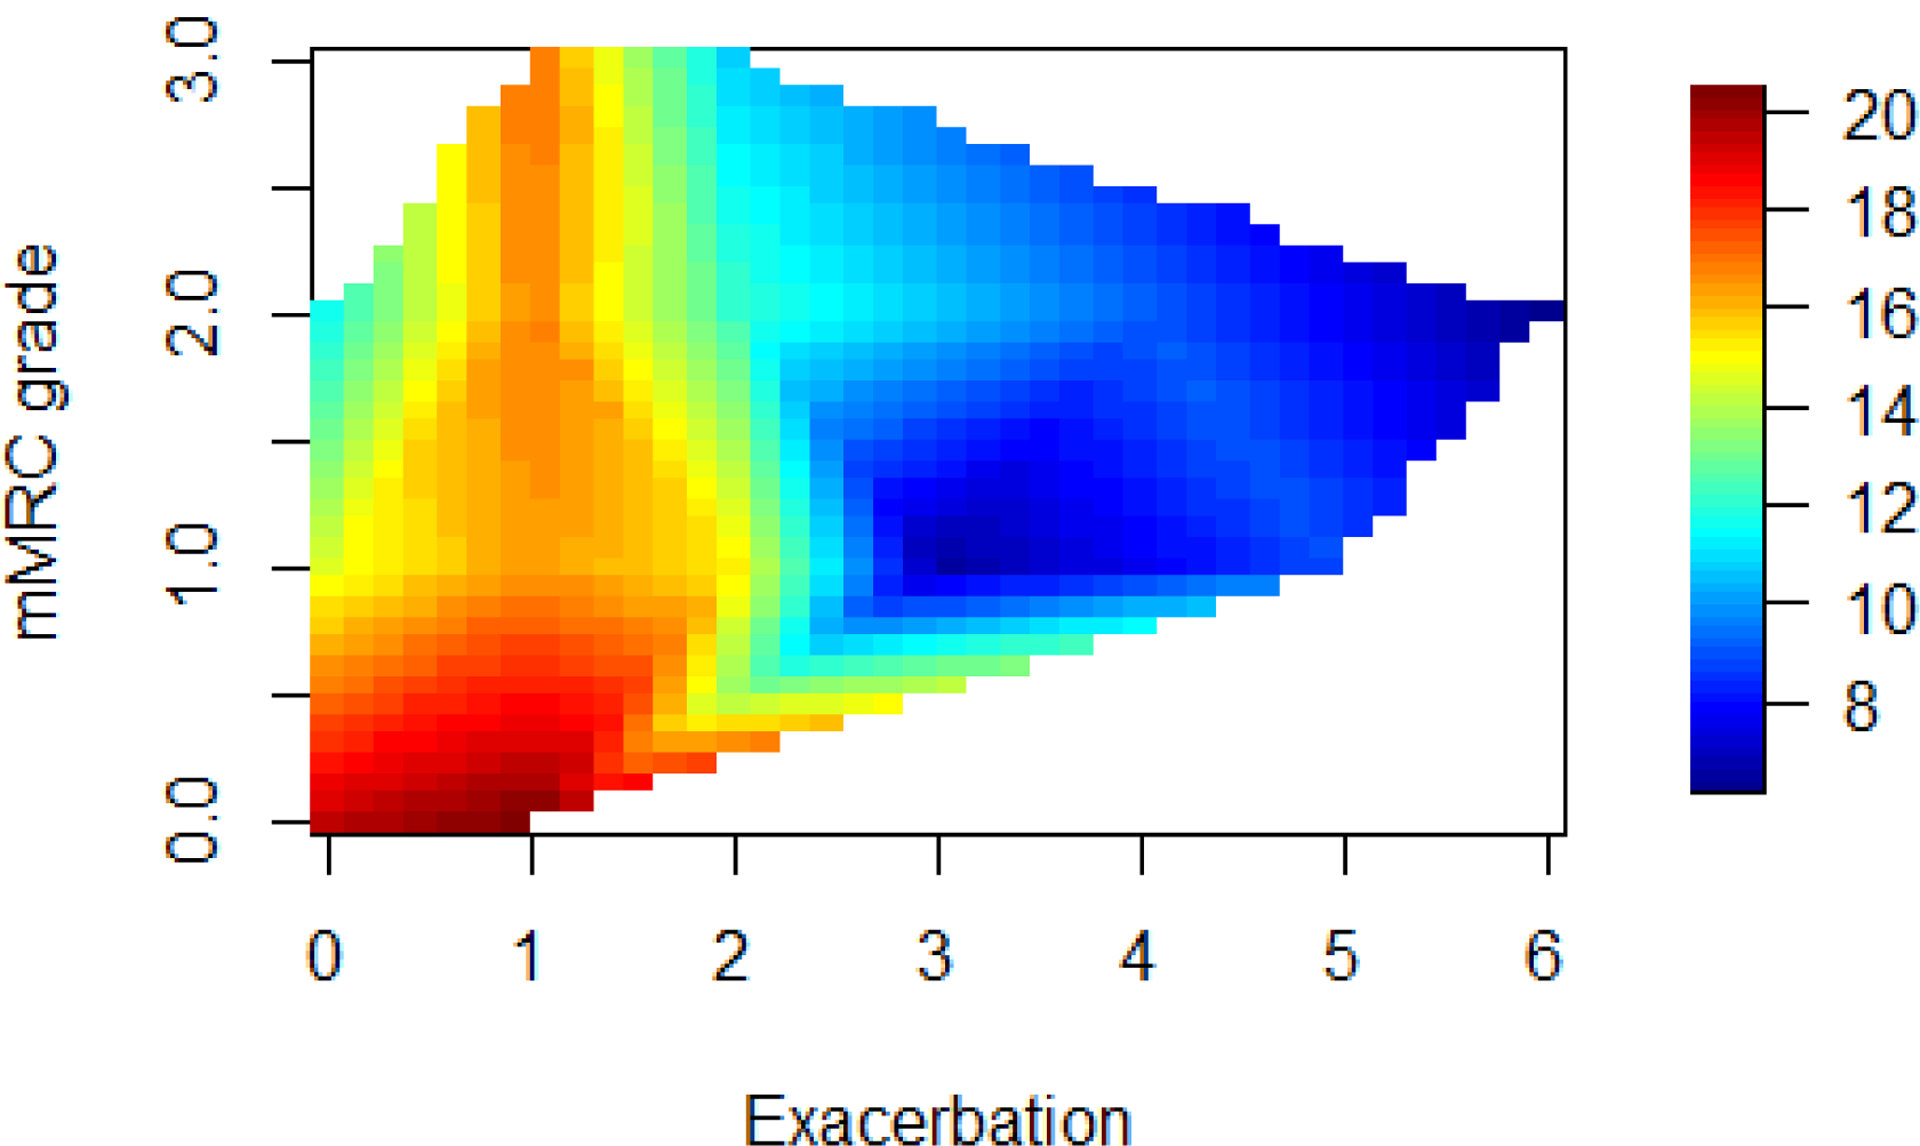
Contour Plot: The axes are those used in the allocation rule: Vitamin D levels, mMRC and COPD exacerbations. The colour in the right side bar in the graph indicates Vitamin D levels. All the subjects with 3 or more exacerbations had Vitamin D levels below 15ng/ml.