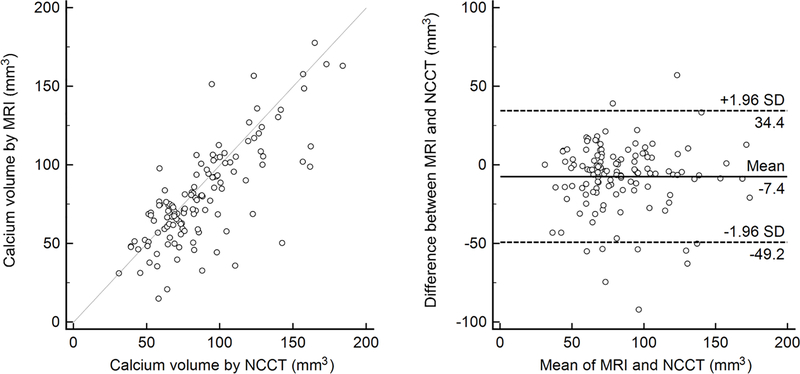
Figure 3 –
Correlation between PDIP-SOS and NCCT-based calcification assessment. Scatter plot shows significant correlation (r=077, P<0.0001) between PDIP-SOS and NCCT based vascular calcium quantification. Bland-Altman analysis indicates good agreement in vascular calcium quantification between PDIP-SOS and NCCT with a −7.4mm3 underestimation by the MRI technique. PDIP-SOS, proton density weighted, in-phase 3D stack-of-stars; NCCT, non-contrast computed tomography

