
Figure 1.
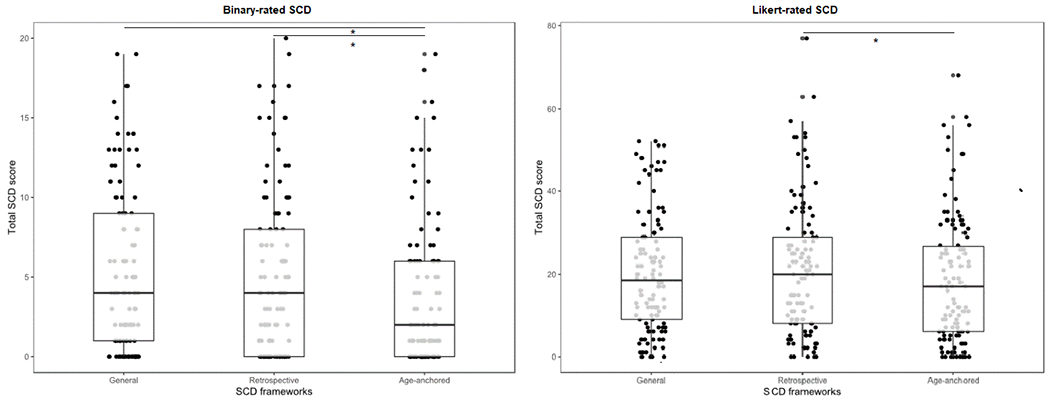
Binary-rated and Ordinal-rated SCD ratings across reference groups.
Boxplot with median and standard error (bars) represented for each SCD reference group. *Significant differences of p value < .05.
Official websites use .gov
A
.gov website belongs to an official
government organization in the United States.
Secure .gov websites use HTTPS
A lock (
) or https:// means you've safely
connected to the .gov website. Share sensitive
information only on official, secure websites.
Binary-rated and Ordinal-rated SCD ratings across reference groups.
Boxplot with median and standard error (bars) represented for each SCD reference group. *Significant differences of p value < .05.