Figure.

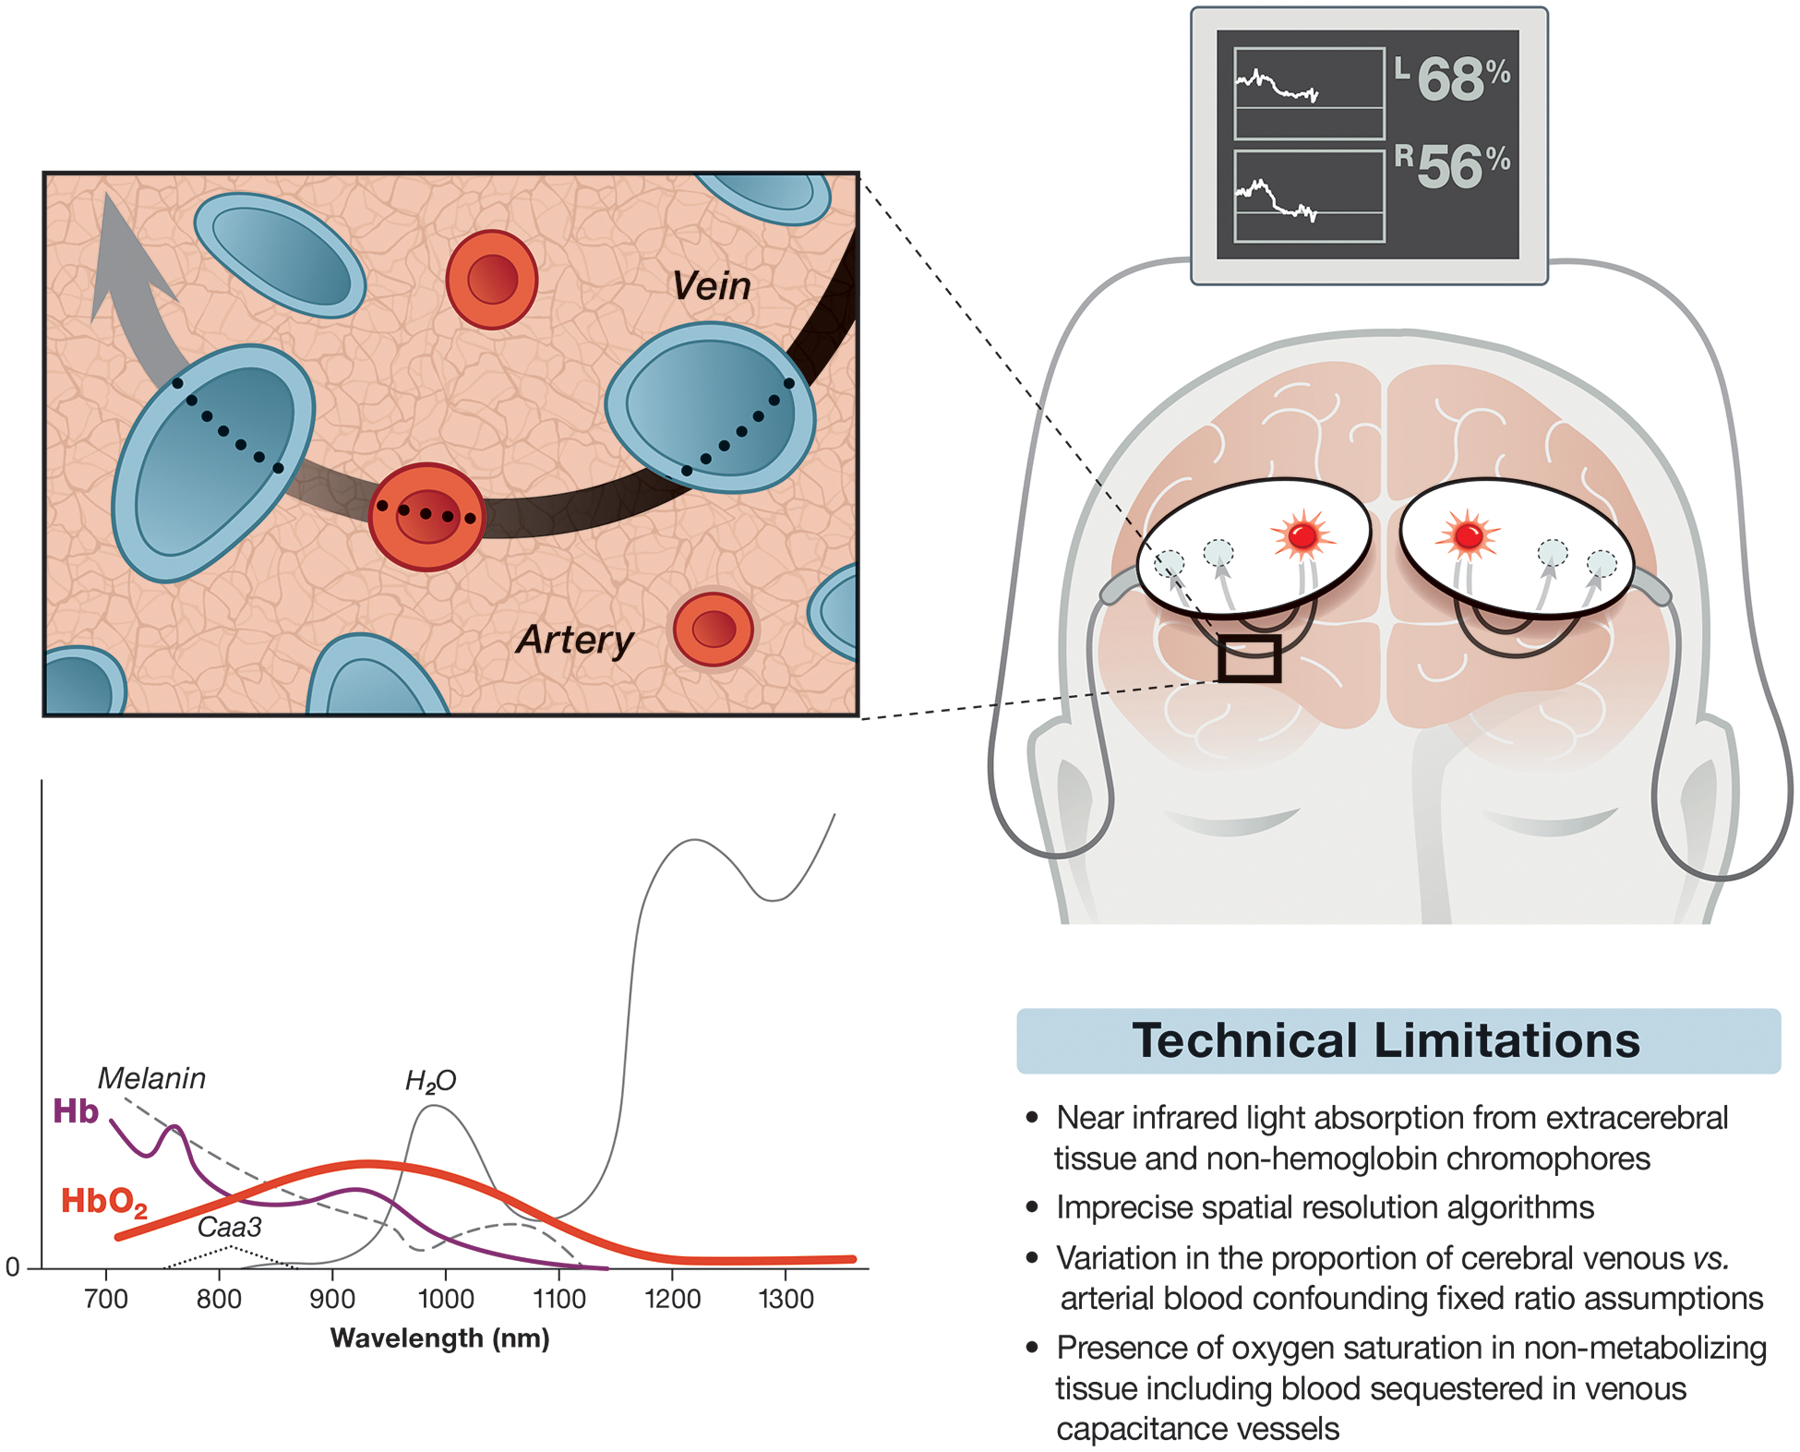
Schematic representation of cerebral oximetry monitoring depicting adhesive light emitter/sensors placed on a hypothetical patient’s forehead. The sensors are connected via cables to a monitor providing regional cerebral oxygen saturation for the right and left superficial frontal lobes. The path of light from the light source to the sensors is elliptical as suggested by computer modeling. The inset is meant to represent the microcirculation with a proposed 70:30 ratio of veins and arteries. Also shown is a sketch of near infrared light spectra versus hypothetical absorption (y-axis). Deoxyhemoglobin (Hb) and oxyhemoglobin (HbO2) are highlighted as thin and thick colored lines, respectively, while absorption spectrum for other light absorbing substances are shown including cytochrome aa2 (Caa3). Commercial cerebral oximeters focus on those wavelengths below the peak absorption of H2O but still in the range of light absorption from melanin. Note the 810 nm isobestic wavelength where peak absorption of Hb and HbO2 occurs. The absorption of near infrared light at this wavelength is used for measuring total hemoglobin for calculating relative cerebral oxygen saturation as well as for estimating cerebral blood volume for monitoring cerebral vasoreactivity (see text). A table summarizing some limitations of cerebral oximetry is further shown.
