
Fig. 6. Molecular dynamic simulations to predict the interactions between TEV13 and TEV protease.
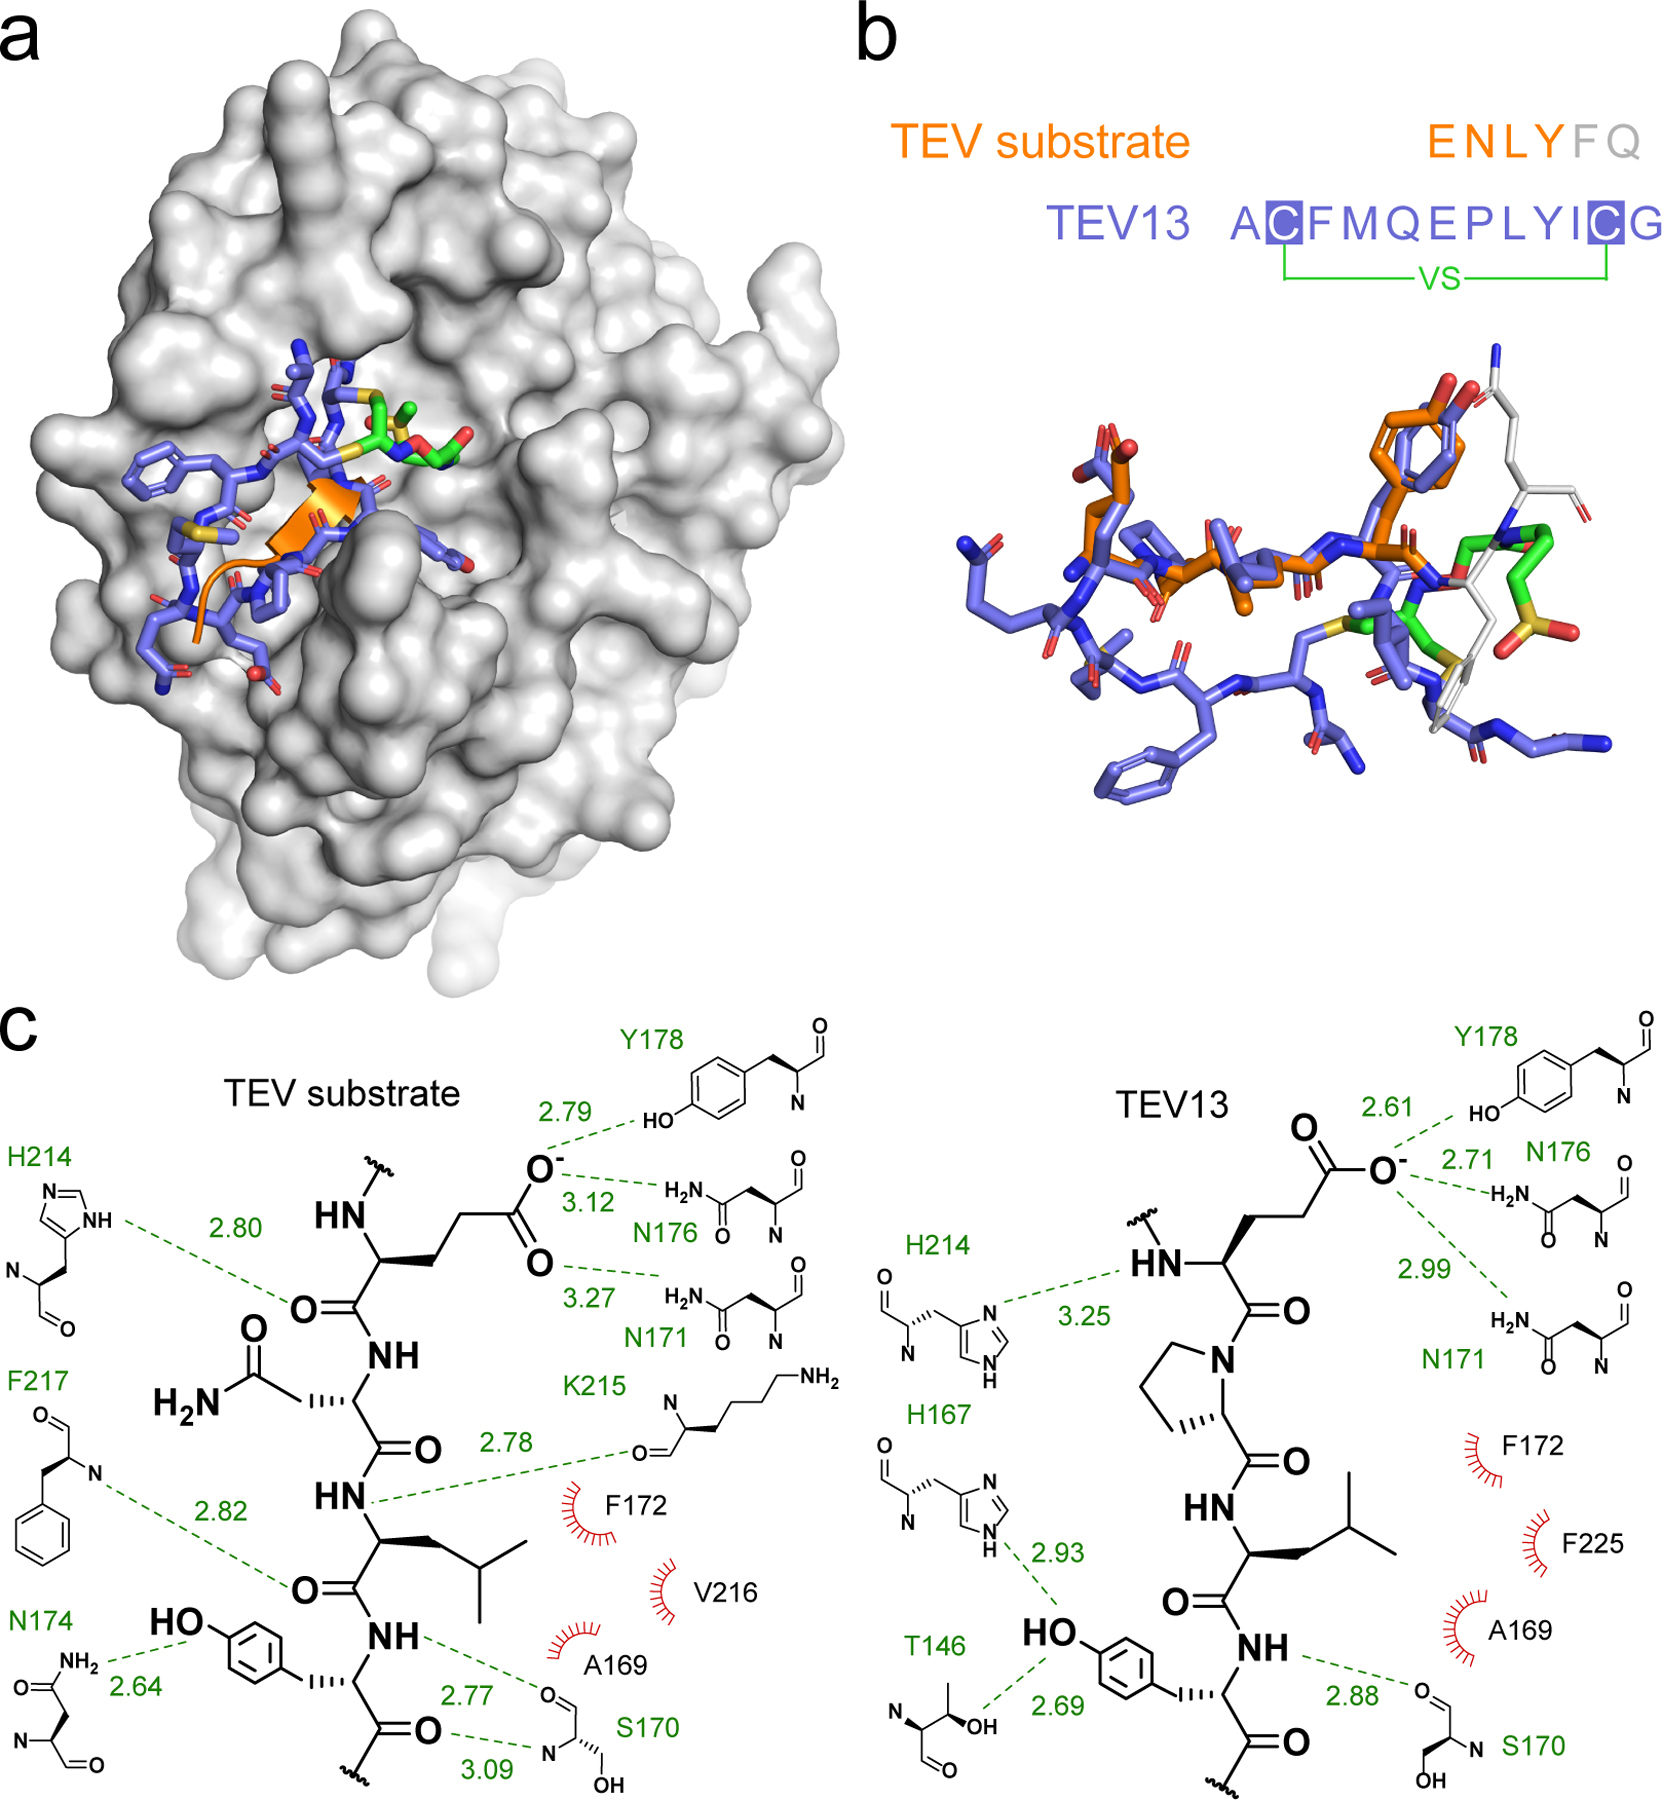
a) The MD minimized complex structure of TEV13 (colored in blue) bound to TEV protease (colored in gray). The native substrate of TEV protease is shown as an orange ribbon as found in the reported crystal structure (PDB ID: 1LVM). b) Structure of the MD optimized TEV-bound TEV13 layered onto the reported X-ray crystal structure of the native peptide substrate ENLYFQ. The key residues P3–6 that overlap with residues in TEV13 are shown in orange. c) Extended diagrammatic representation of interactions between key residues on the native substrate and TEV13 and the active site region of the TEV protease. H-bond interacting partners are shown with green dash lines with distance indicated in Å. Hydrophobic interactions are depicted as red radiations.