
FIGURE 2.
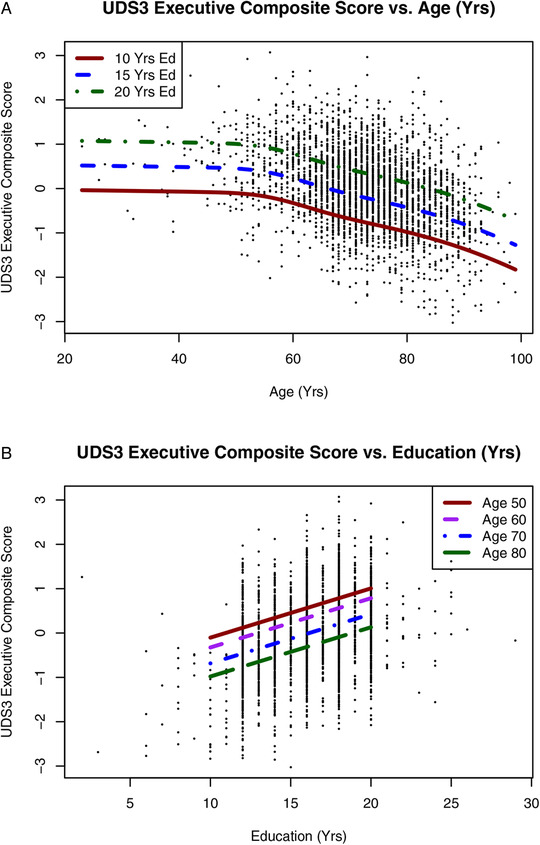
A–B, Scatterplots showing UDS3‐EF scores in the NACC sample as a function of age with separate fit lines for years of education (A) and as a function of education with separate fit lines for age groups (B). NACC, National Alzheimer's Coordinating Center; UDS3, Uniform Data Set version 3.0