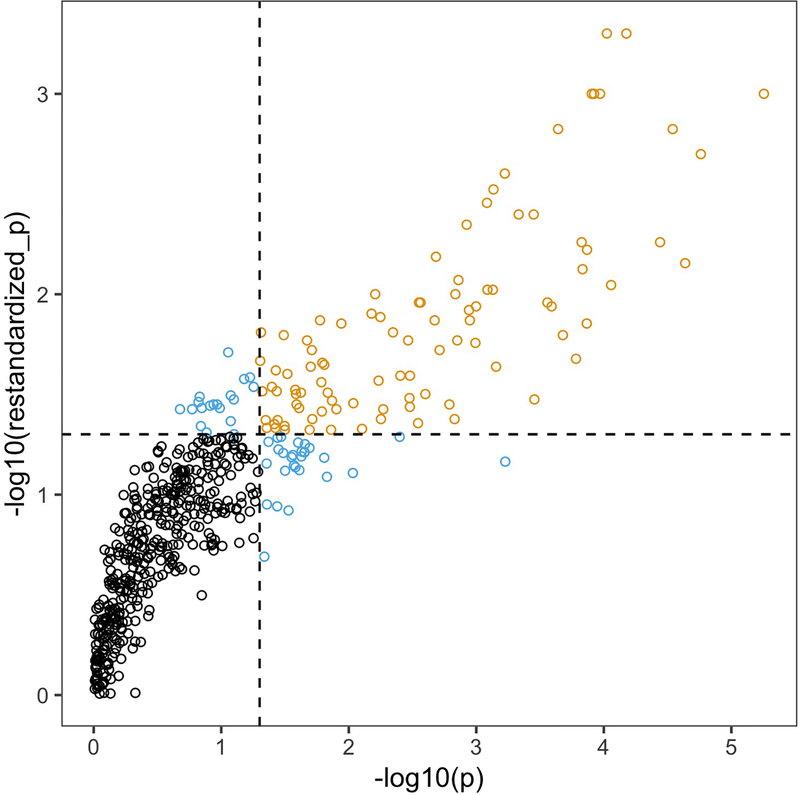
Figure 1:
Comparison of p-values obtained from the independence assumption test (x-axis) and the permutation test (y-axis) run on 542 gene sets in Alzheimer’s proteomics data (Section 5). Black color indicates that neither test rejects, gold indicates that both tests reject, and light blue indicates that only one test rejects. Note the difference in ranges on the axes: the permutation test is more conservative than the independence assumption test.

