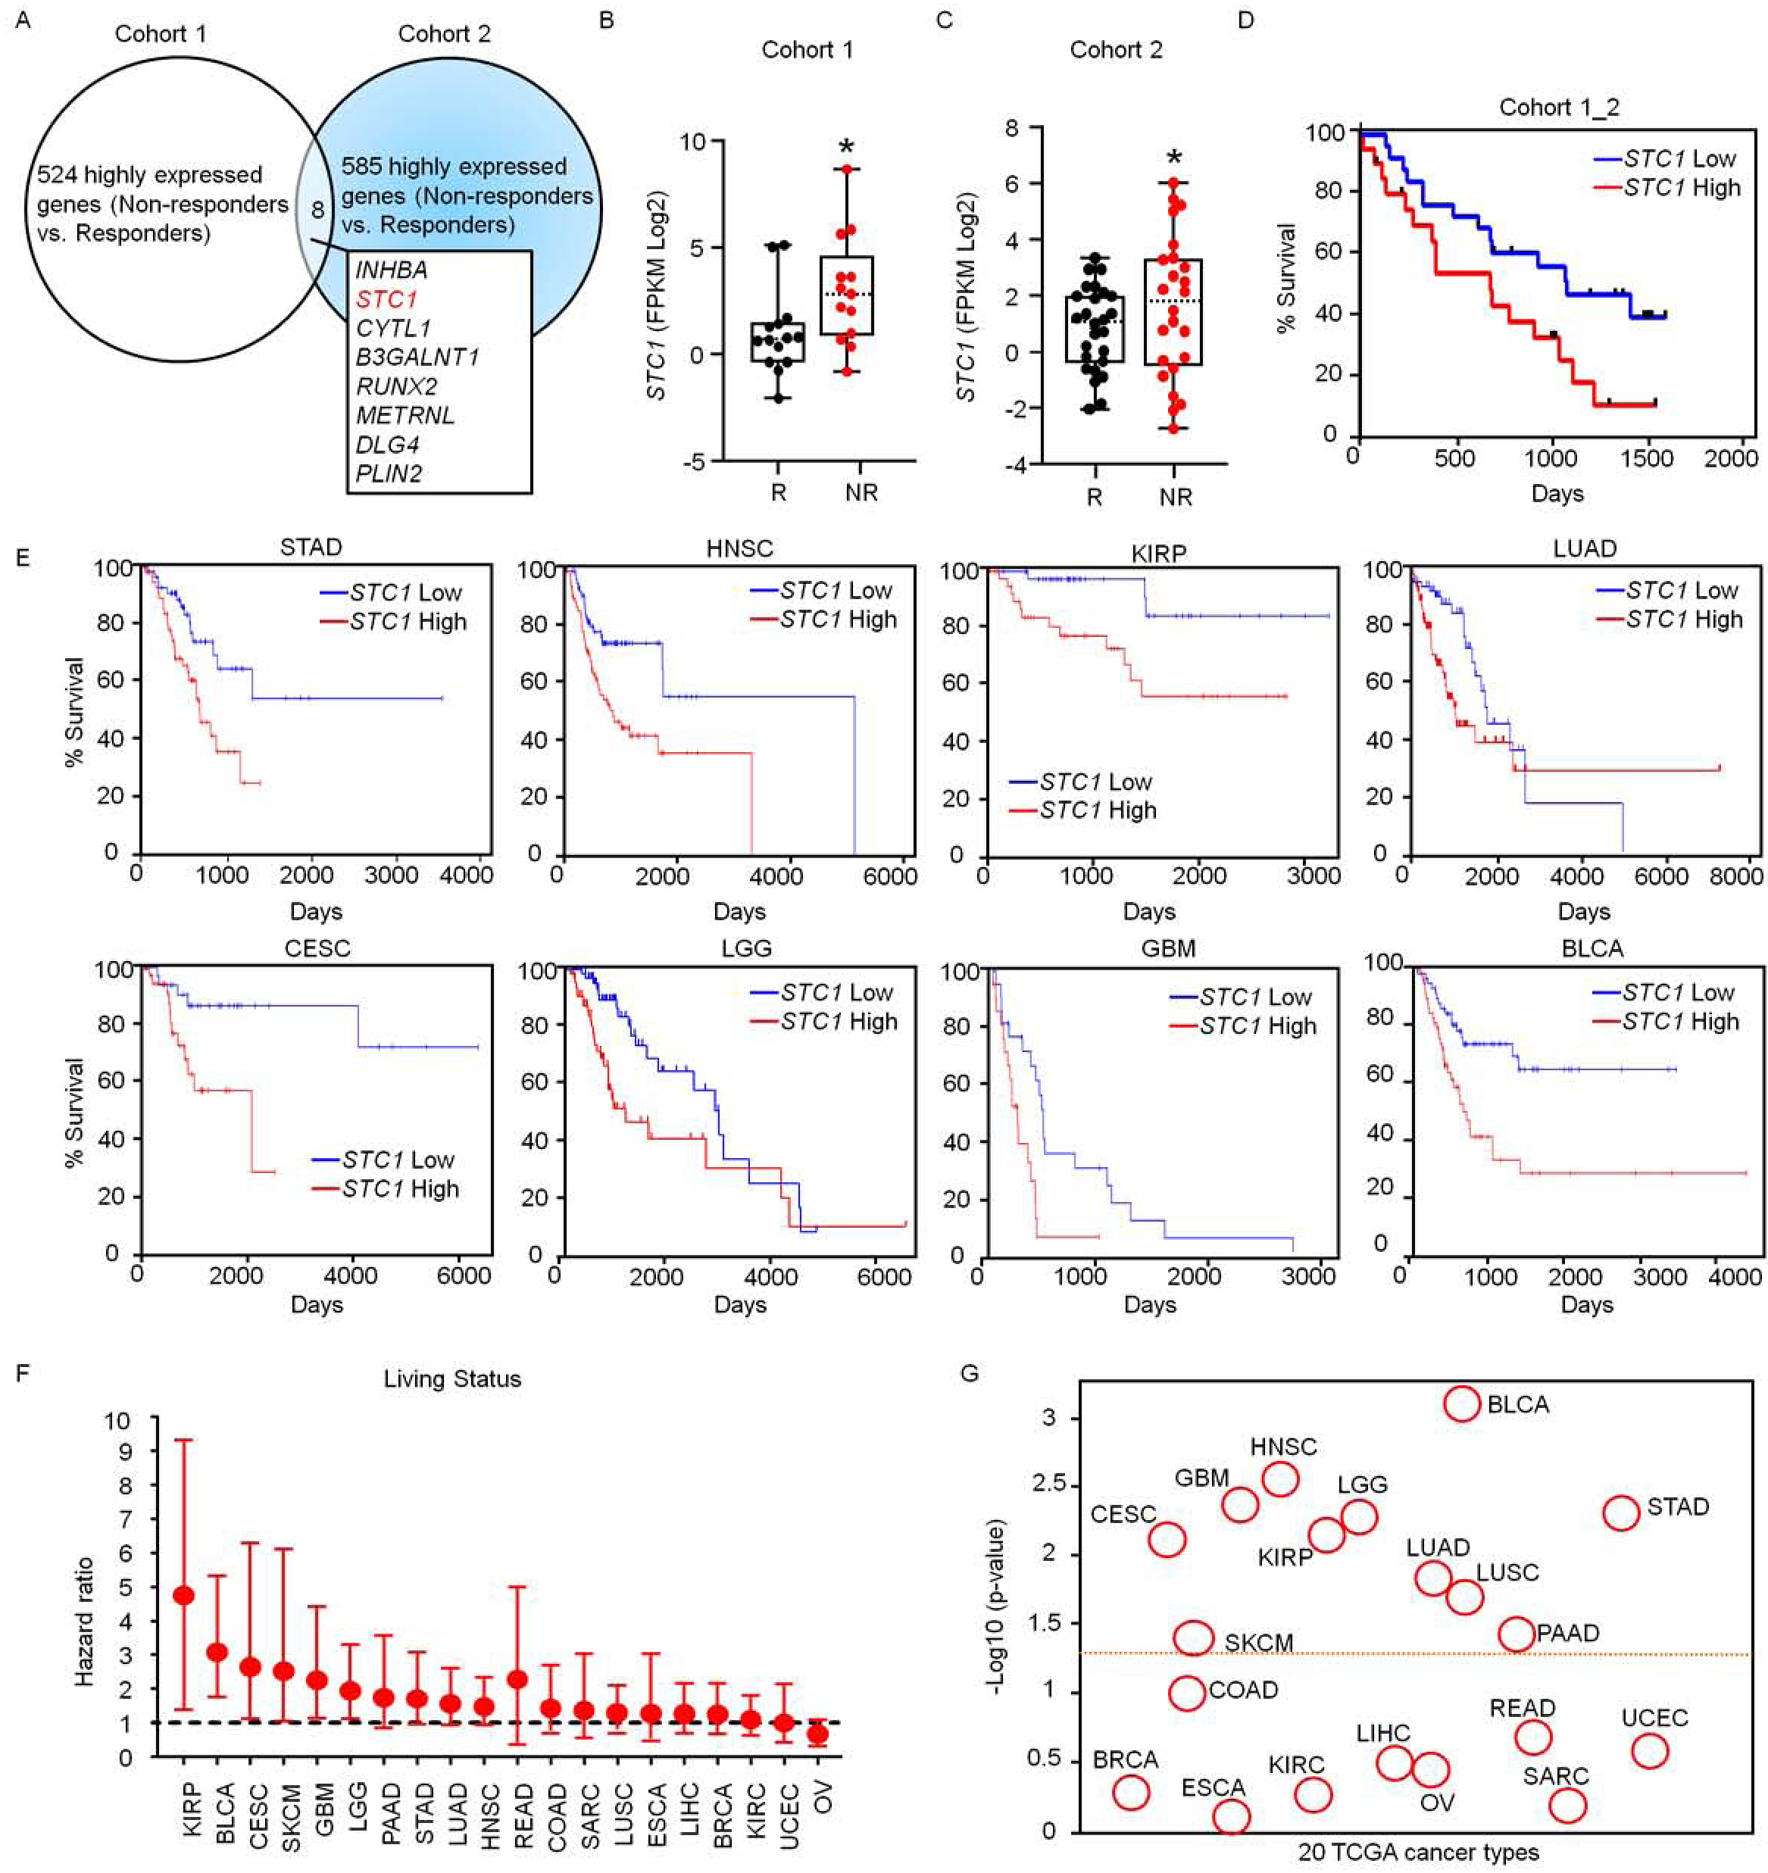
Figure 1. STC1 correlates to cancer resistance to immunotherapy.

(A) Transcriptome analysis in patients treated with checkpoint blockade. Upregulated genes in non-responders treated with checkpoint blockade were determined in cohorts 1 (Hugo et al., 2016) and 2 (Riaz et al., 2017). The overlapping upregulated genes in 2 cohorts are shown. Cohort 1, n = 15 (responders), 13 (non-responders); Cohort 2, n = 26 (responders), 25 (non-responders).
(B-C) Expression of STC1 transcripts in Responders (R) and Non-Responders (NR) in cohort 1 (B) n = 14 (R), 13 (NR), p = 0.0287; and cohort 2 (C) n = 26 (R), 25 (NR), p = 0.0301. The dash line represents the median value, the bottom and top of the boxes are the 25th and 75th percentiles (interquartile range). Whiskers encompass 1.5 times the inter-quartile range.
(D) Association of STC1 expression levels with cancer patient survival analyzed on combined cohorts 1 and 2, STC1 high (n = 22) and low (n = 27) expression, p = 0.0385.
(E-G) Relationship of STC1 expression with cancer patient survival in 18 cancer types in TCGA data set. Results are shown as individual cancer survival curves with top 15% high and low STC1 expression (E); living status (F) Forest plot represents the adjust value of Cox proportional hazard ratio (HR) and 95% confidential interval (CI) of overall survival; and p-values (G) (STAD n = 56, p = 0.00475; HNSC n = 74, p = 0.00272; KIRP n = 42, p= 0.00698; LUAD n = 73, p = 0.0145; CESC n = 39, p = 0.00762; LGG n = 76, p = 0.00521; GBM n = 22, p = 0.00421; BLCA n = 60, p= 0.000765)
See also Figure S1.
