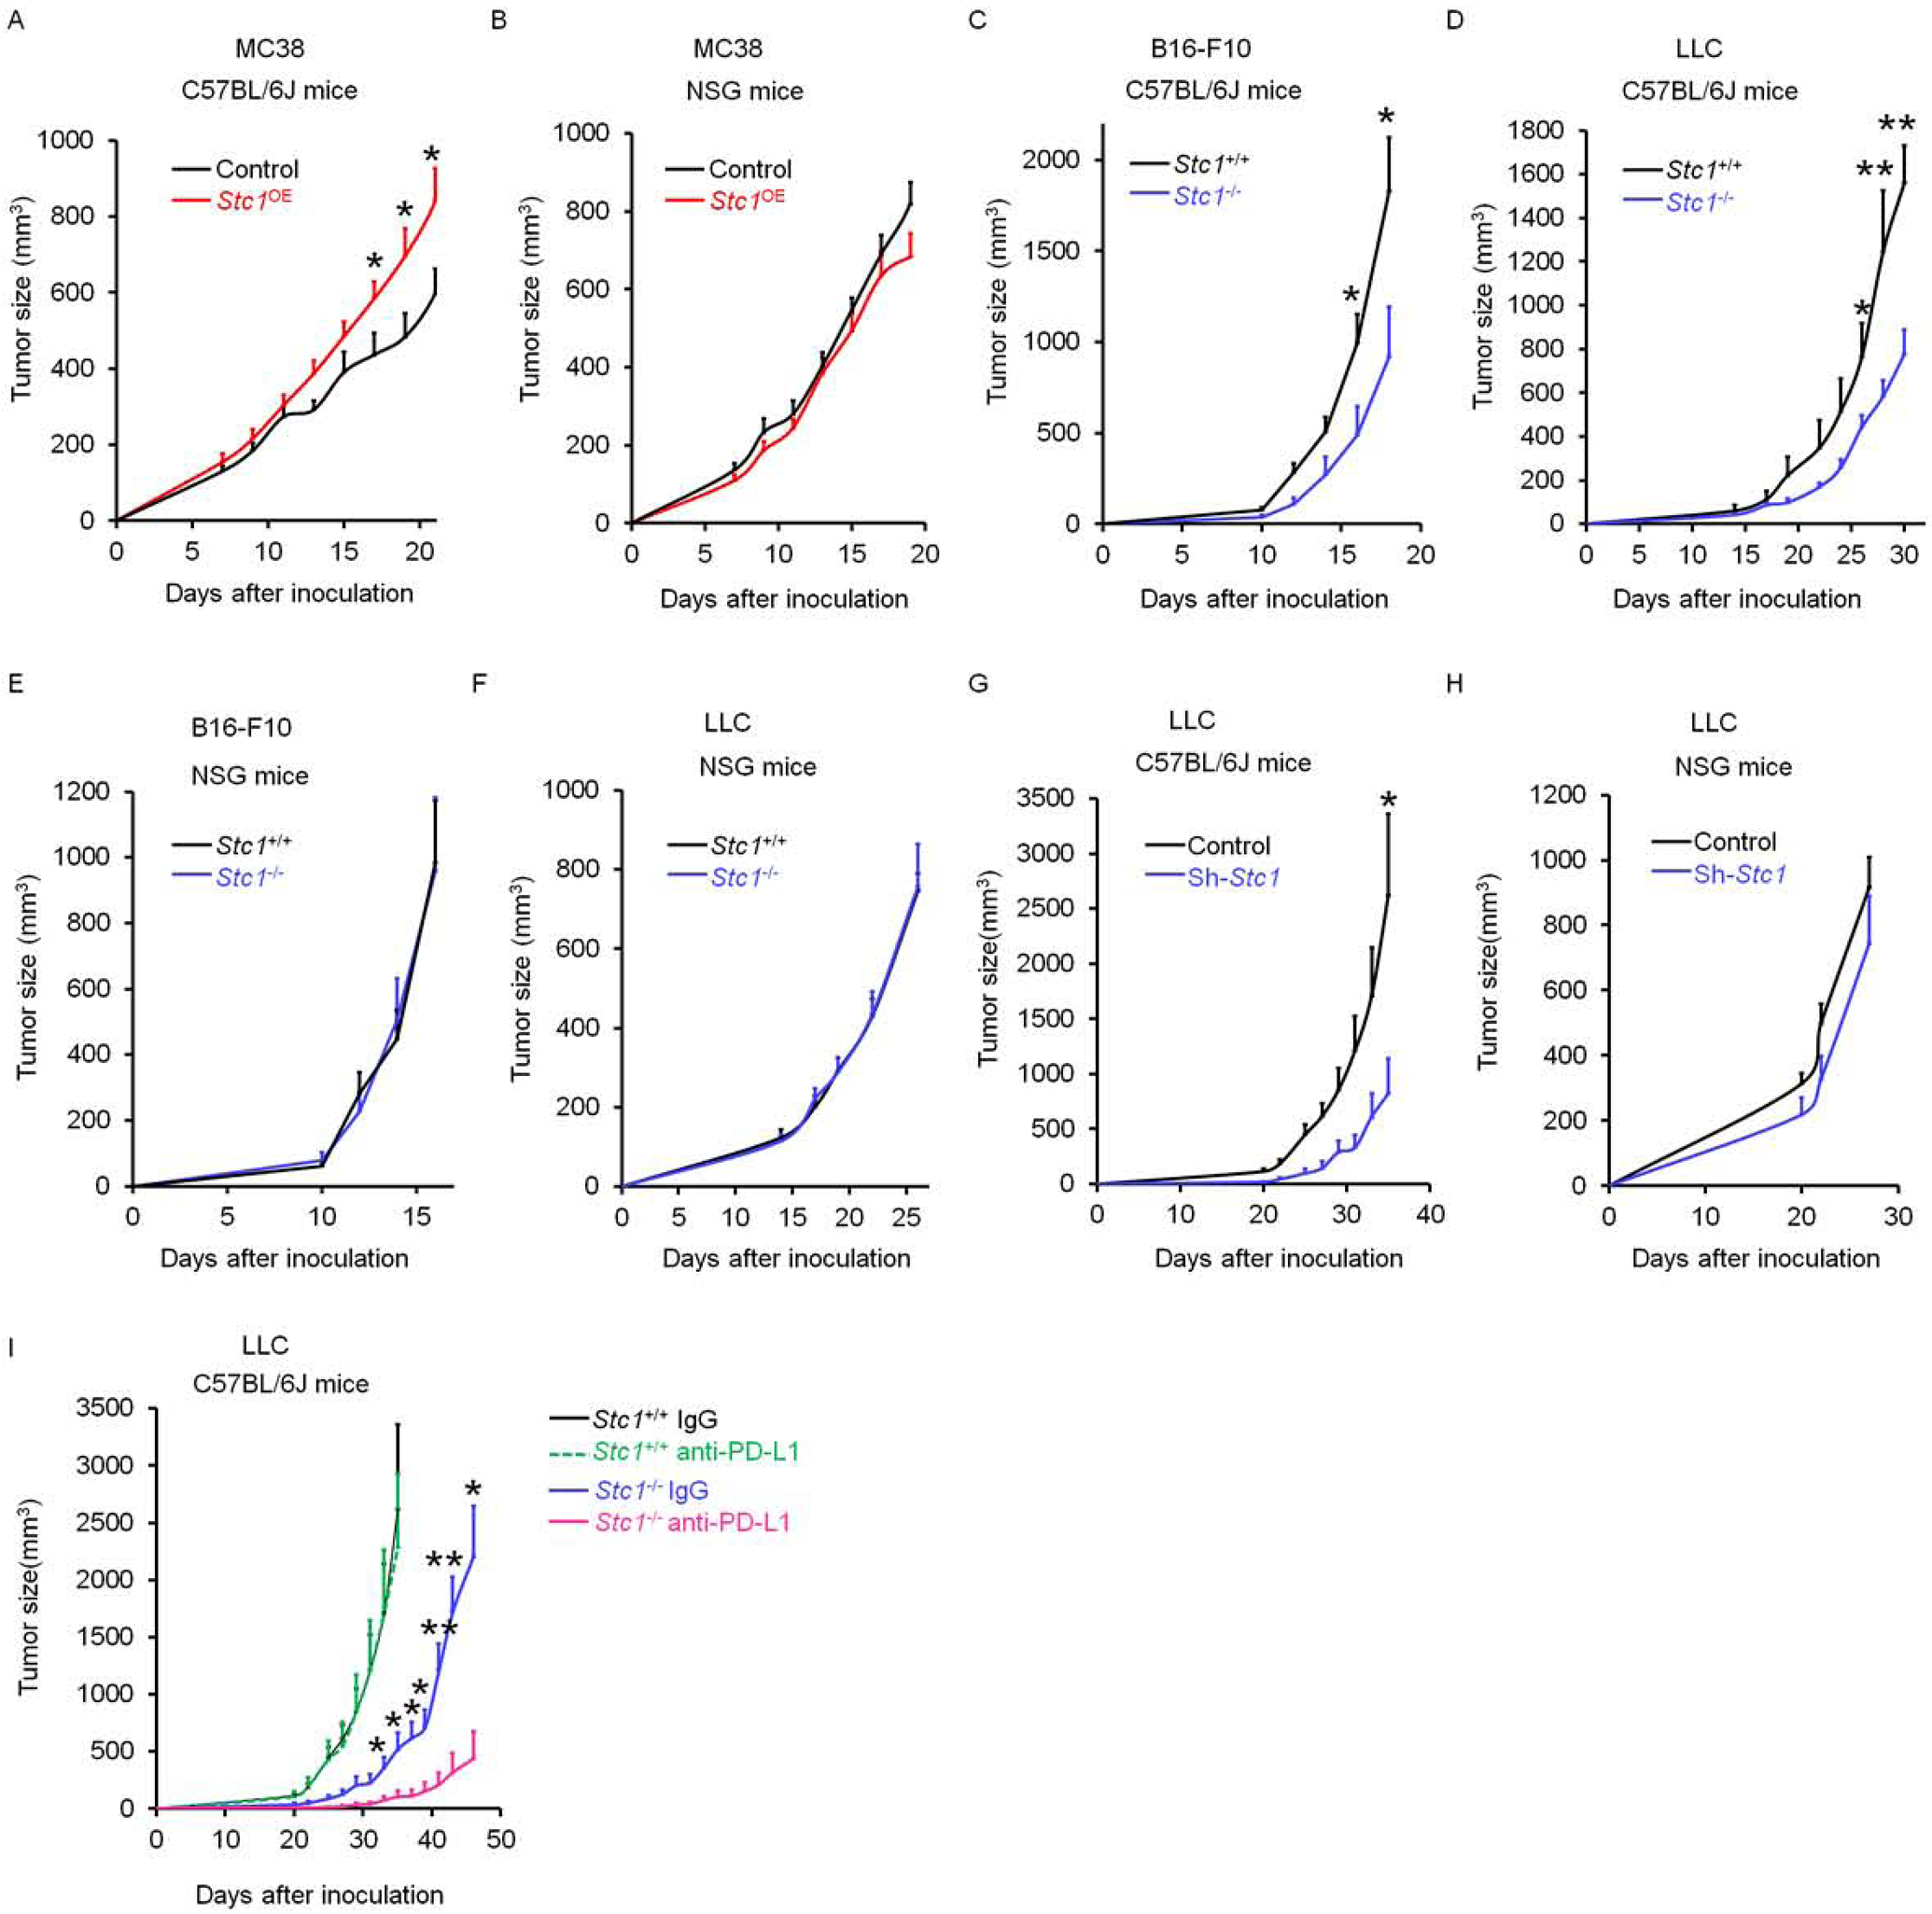
Figure 2. Tumor STC1 is critical for intrinsic resistance to tumor immunity.

(A-B) Tumor growth curves of control MC38 and Stc1OE MC38 in (A) C57BL/6J mice and (B) NSG mice (n = 8).
(C-F) Tumor growth curves of Stc1+/+ and Stc1−/− LLC, and Stc1+/+ and Stc1−/− B16-F10 in (C, D) C57BL/6J mice and (E, F) NSG mice (n = 5–8).
(G-H) Tumor growth curves of control LLC and shStc1 LLC in (G) C57BL/6J mice and (H) NSG mice (n = 4–5).
(I) Tumor growth curves of Stc1+/+ and Stc1−/− LLC tumors in (I) C57BL/6J mice with anti-PD-L1 or isotype control antibodies treatments every 3 days starting day 3 (n = 4–7).
Data are shown as mean ± SEM, 2 tail t-test was used for two-way comparisons (A-I) (*p < 0.05, **p < 0.01).
See also Figure S2.
