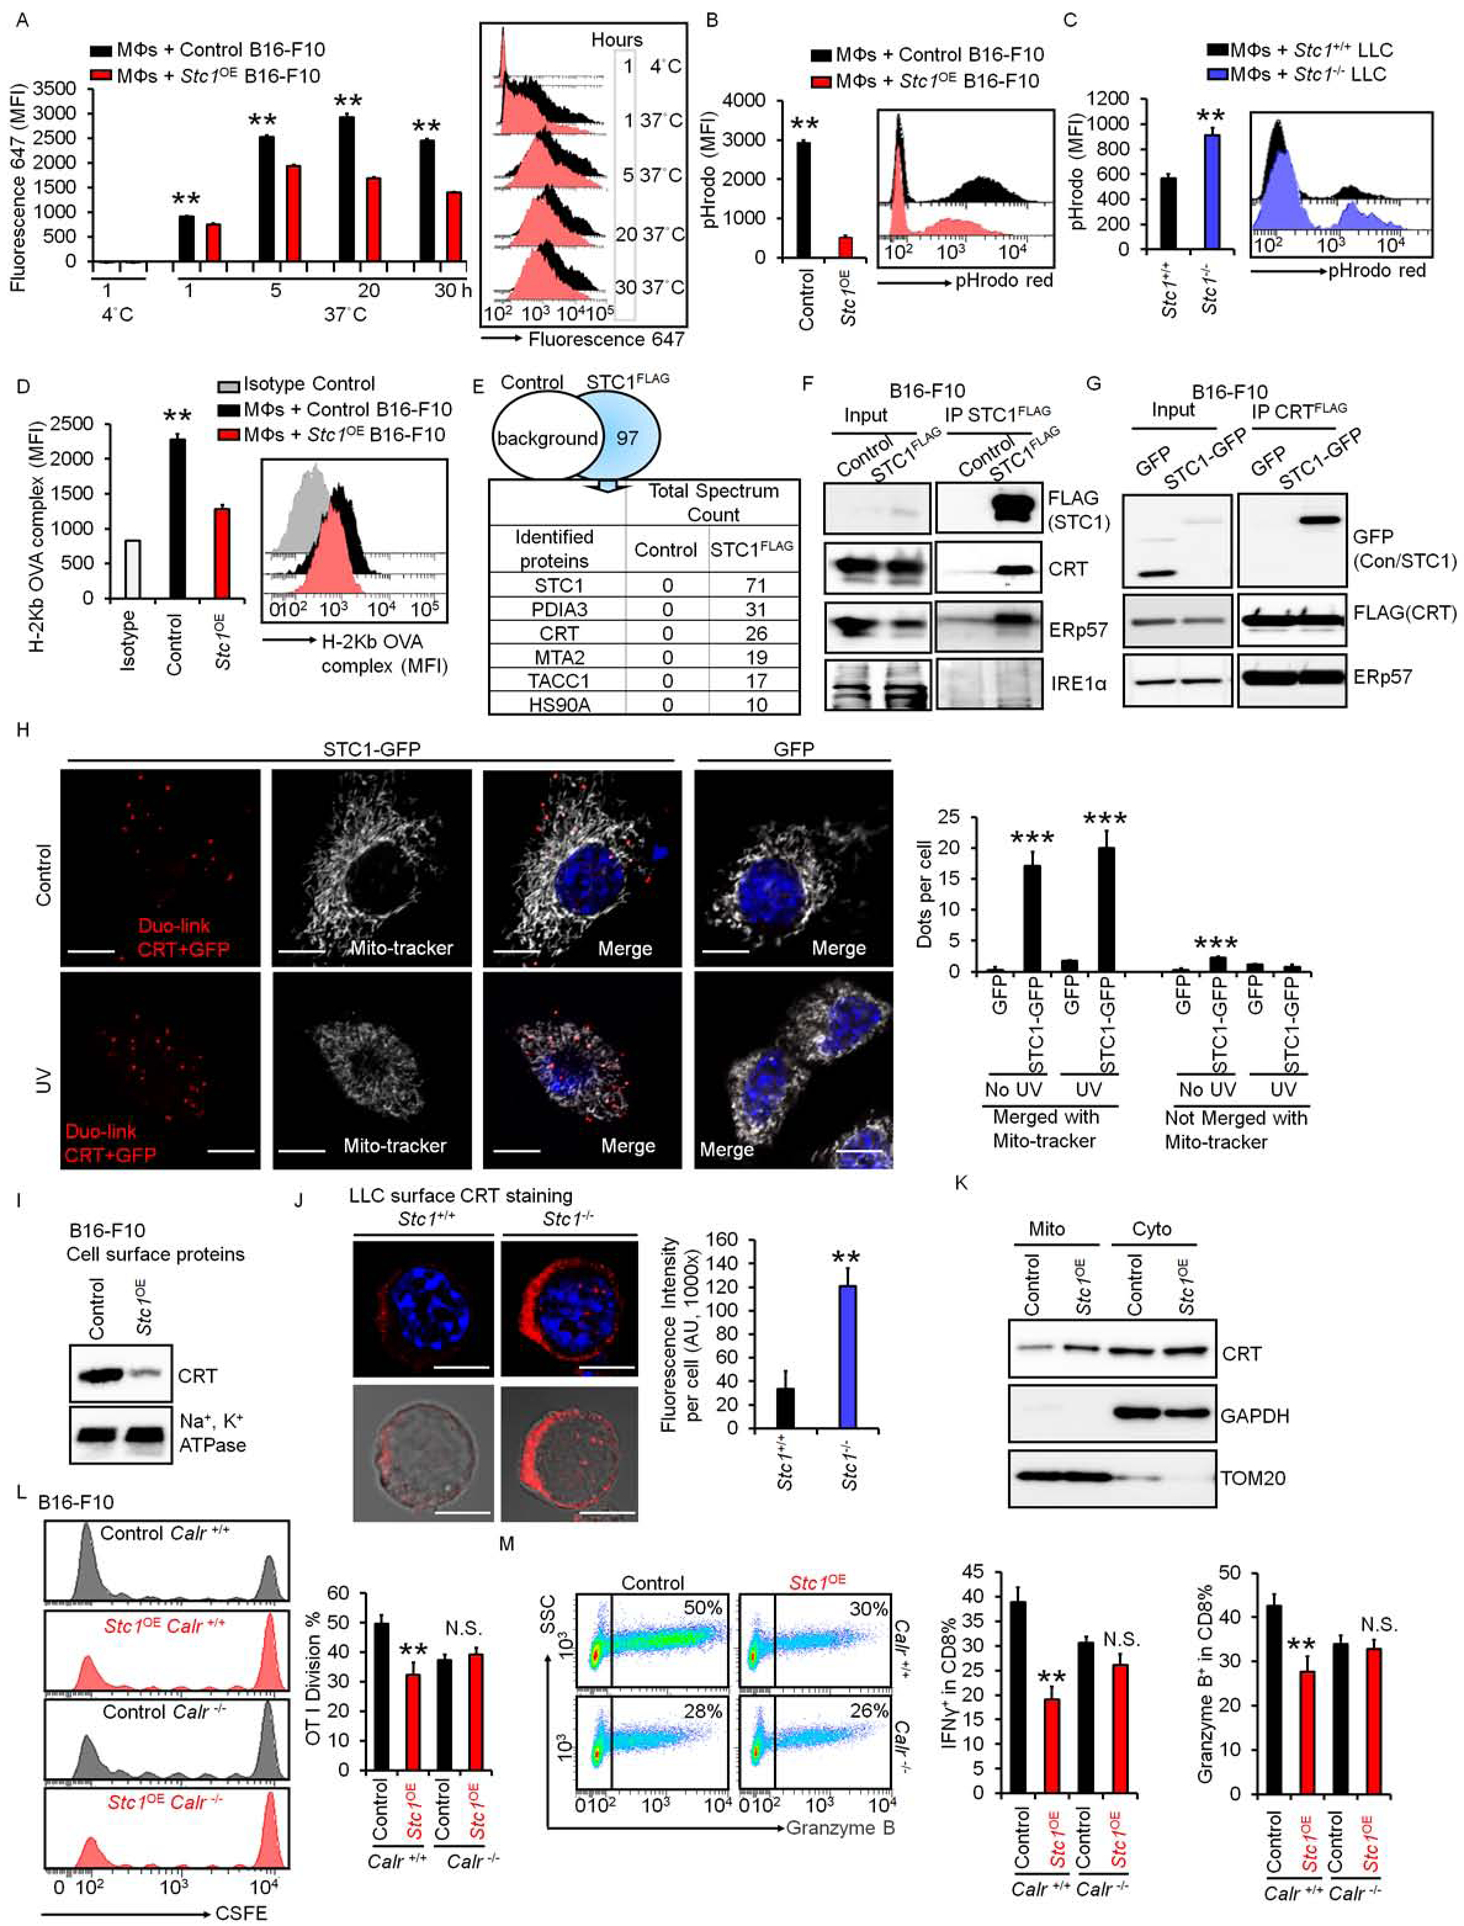
Figure 5. Tumor STC1 traps CRT to inhibit macrophage function.

(A) Effect of Stc1 on macrophage-mediated phagocytosis. Macrophages were incubated with dead cells from fluor-647 labeled B16-F10 cells and fluor-647 labeled Stc1OE B16-F10 cells. Mean fluorescence intensity (MFI) of fluorescence 647 in macrophages, gated on CD11b+ cells, determined by FACS. Data are presented as mean ± SEM, 2 tail T-test was used for two-way comparisons (n = 6, *p < 0.05, **p < 0.01).
(B-C) Effect of Stc1 on macrophage-mediated bead up-taking. Macrophages were incubated with dead cells from B16-F10 cells and Stc1OE B16-F10 cells (B) or Stc1+/+ and Stc1+/+ LLC cells (C) for 20 hours. pHrodo™-SE labeled 3 μm latex beads were added for 1 hour. Red pHrodo signals in macrophages were determined by FACS. Data are shown as mean ± SEM (n = 4, *p < 0.05, **p < 0.01).
(D) Effect of Stc1 on antigen presentation. Macrophages were incubated with dead cells from OVA-loaded B16-F10 cells (control) and OVA-loaded Stc1OE B16-F10 cells for 48 hours. Surface OVA-binding-H2b complex expression (MFI) in macrophages were determined by FACS (n = 3, **p < 0.01).
(E) Mass spectrum showing STC1 interactive proteins. FLAG-IP was conducted in dead cells from STC1-FLAG expressing B16-F10 cells. Mass spectrum was subsequently performed in the FLAG-IP proteins. Control, cell lysates from B16-F10 cells without STC1-FLAG. Top 5 hits are shown.
(F) Interaction between endogenous CRT and STC1. Co-IP of STC1-FLAG was conducted with endogenous CRT, ERp57, and IRE1α in B16-F10 cells. One of 2 representative experiments is shown.
(G) Interaction between exogenous CRT and STC1. Co-IPs of CRT-FLAG with STC1-GFP and ERp57 were performed in cell lysates from UV-treated or non-treated B16-F10 cells. One of 2 representative experiments is shown.
(H) Duo-link showing the interactions (Red) of CRT and STC1-GFP, co-localizing with mito-tracker (white) in B16-F10 cells transfected with GFP or STC1-GFP with or without UV-treatment. Scale bars: 10 μm. Duo-link dots per cell merged or unmerged with mito-tracker were counted from over 20 images, mean ± SEM (n = 20, ***p < 0.001, STC1-GFP vs. GFP; # p <0.05, UV vs. No UV treatment).
(I) Membrane CRT in B16-F10 cells. UV-treated B16-F10 and Stc1OE B16-F10 cells were labeled with biotin. Western blot showed cell membrane CRT and Na+, K+-ATPase α1 in biotin-labeled proteins. One of 2 representative experiments is shown.
(J) Membrane CRT in UV-treated Stc1+/+ and Stc1−/− LLC cells. Confocal images showed membrane CRT expression. Scale bars: 10 μm. The intensity of CRT expression was analyzed through ImageJ software. Data are shown as mean ± SEM (n = 12, **p < 0.01).
(K) Western blots showing CRT distribution in mitochondria (TOM20) and cytosol (GAPDH) from UV-treated B16-F10 cells and Stc1OE B16-F10 cells. Mito, mitochondria; Cyto, cytosol. One of 2 experiments is shown.
(L-M) Effect of Stc1 on T cell activation in the context of Calr. Calr+/+ or Calr−/− vehicle control and Stc1OE B16-F10 cells were loaded with OVA and killed by UV-irradiation. CFSE-labeled OT-I cells were cultured with different numbers of dead B16-F10 cells with macrophages for 3–4 days. CSFE dilution (L), and granzyme B+ and IFNγ+ (M) OT-I cells were determined by FACS. Data are presented as mean ± SEM, 2 tail T-test was used for two-way comparisons (n = 3–5, **p < 0.01).
See also Figure S5.
