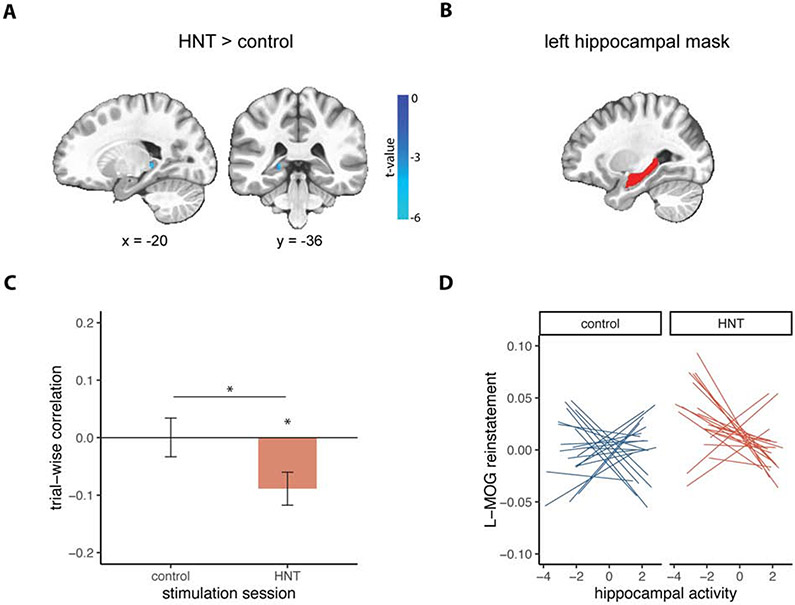
Figure 4. Effects of HNT stimulation on hippocampal contributions to reinstatement.
(A) Univariate activity during encoding masked by the left hippocampus showed a significant cluster of negative activation for HNT vs control stimulation sessions (p < 0.005 cluster corrected, image thresholded at p = 0.01 for visualization purposes). Voxel-wise t-values are overlaid on a template MNI brain. (B) Left hippocampal mask used for (A), and for calculating average hippocampal activity for (C) and (D). (C) Mean within-subject (trial-wise) correlation between left hippocampal activity at encoding and reinstatement in left middle occipital gyrus (L-MOG) for control (blue) and HNT (red) stimulation sessions. Error bars represent standard error of the mean. Asterisks indicate significant comparisons (p< 0.05). (D) Within-subjects correlation between hippocampal activity and L-MOG reinstatement plotted for control and HNT stimulation sessions separately. Each line represents an individual participant’s linear fit for a given session. See Figure S1 for additional within-subjects correlations exploring the association between hippocampal activity and reinstatement.

