
Fig 2.
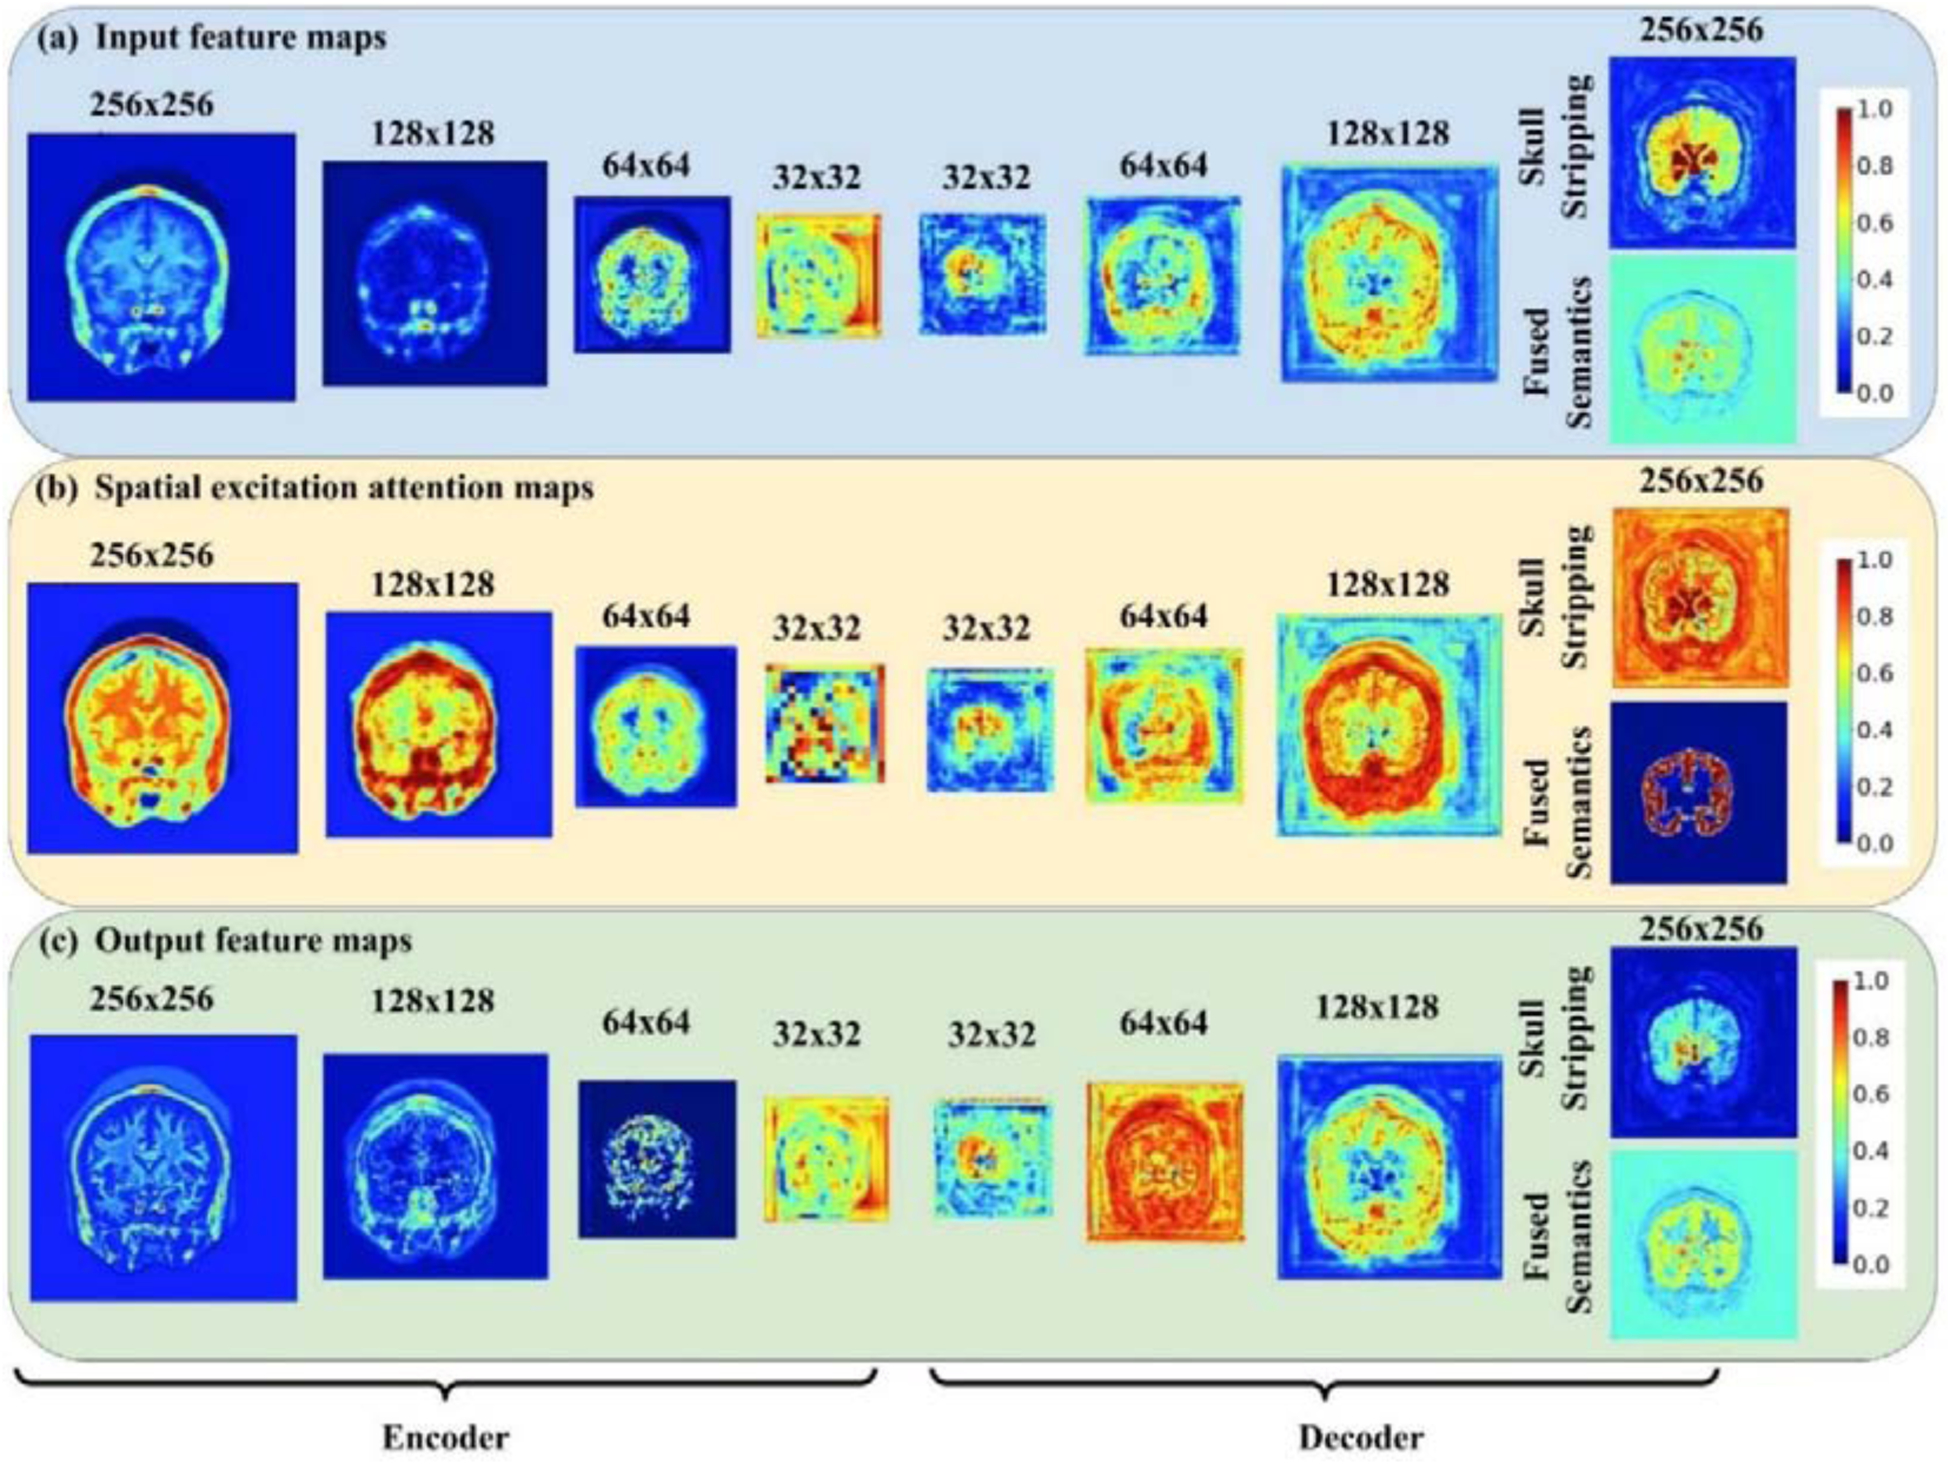
Visualization of (a) input feature maps, (b) spatial-wise attention maps and (c) output feature maps learned from encoders and decoders of ACEnet for segmenting coarse-grained brain structures on the 2012 MALC data set. Intensity values of all the feature maps and spatial attention maps were normalized into the range of 0 to 1. The first input features were the input image slices.