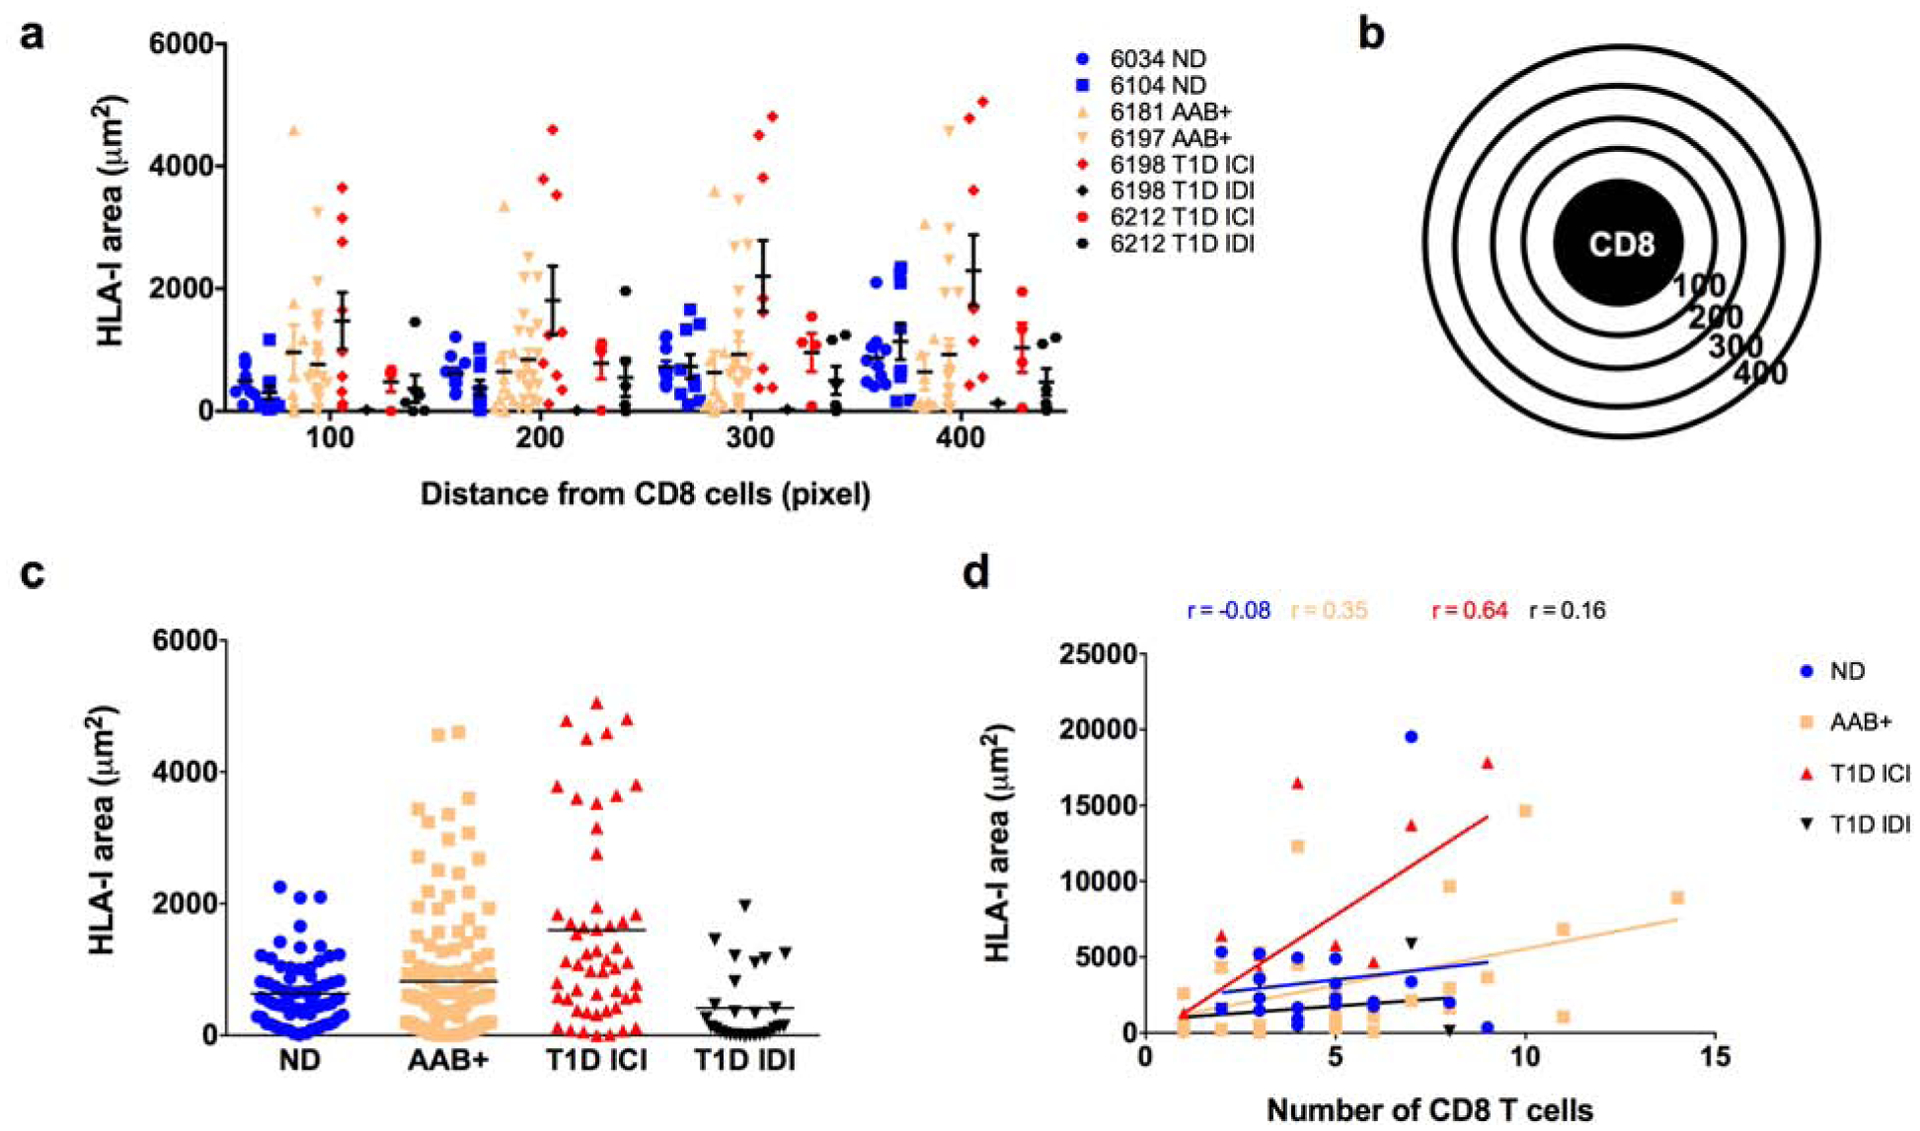
Fig. 4.

Proximity analysis of HLA class I in the surroundings of CD8 T cells. Pancreatic sections from organ donors were stained for HLA-I, CD8, insulin and glucagon. CD8 T cells were detected in the pancreatic tissue sections and a proximity analysis was performed to detect the HLA-I expression in the surroundings of CD8 T cells. (a) Quantification of HLA-I using ImagePro premier in the radials surrounding the CD8 T cells, 100 being the closest to the CD8 cell and 400 the furthest presented by case. Each data point represents the level of HLA-I in a radial circle. (b) Schematic representation of CD8 T cell and the radial circles from 100 to 400 used for the proximity analysis. (c) Quantification of HLA-I presented as the sum of the radials from 100 to 400 and presented by group. Each data point represents an islet. Each data point represents the level of HLA-I in a radial circle (d) Correlation between the number of CD8 T cells per field of view and the total expression of HLA-I in the surroundings of those CD8 T cells. Each data point represents a field of view. ND: non-diabetic; AAB+: autoantibody positive; T1D: type 1 diabetes; ICI: insulin-containing islet; IDI: insulin-deficient islet.
