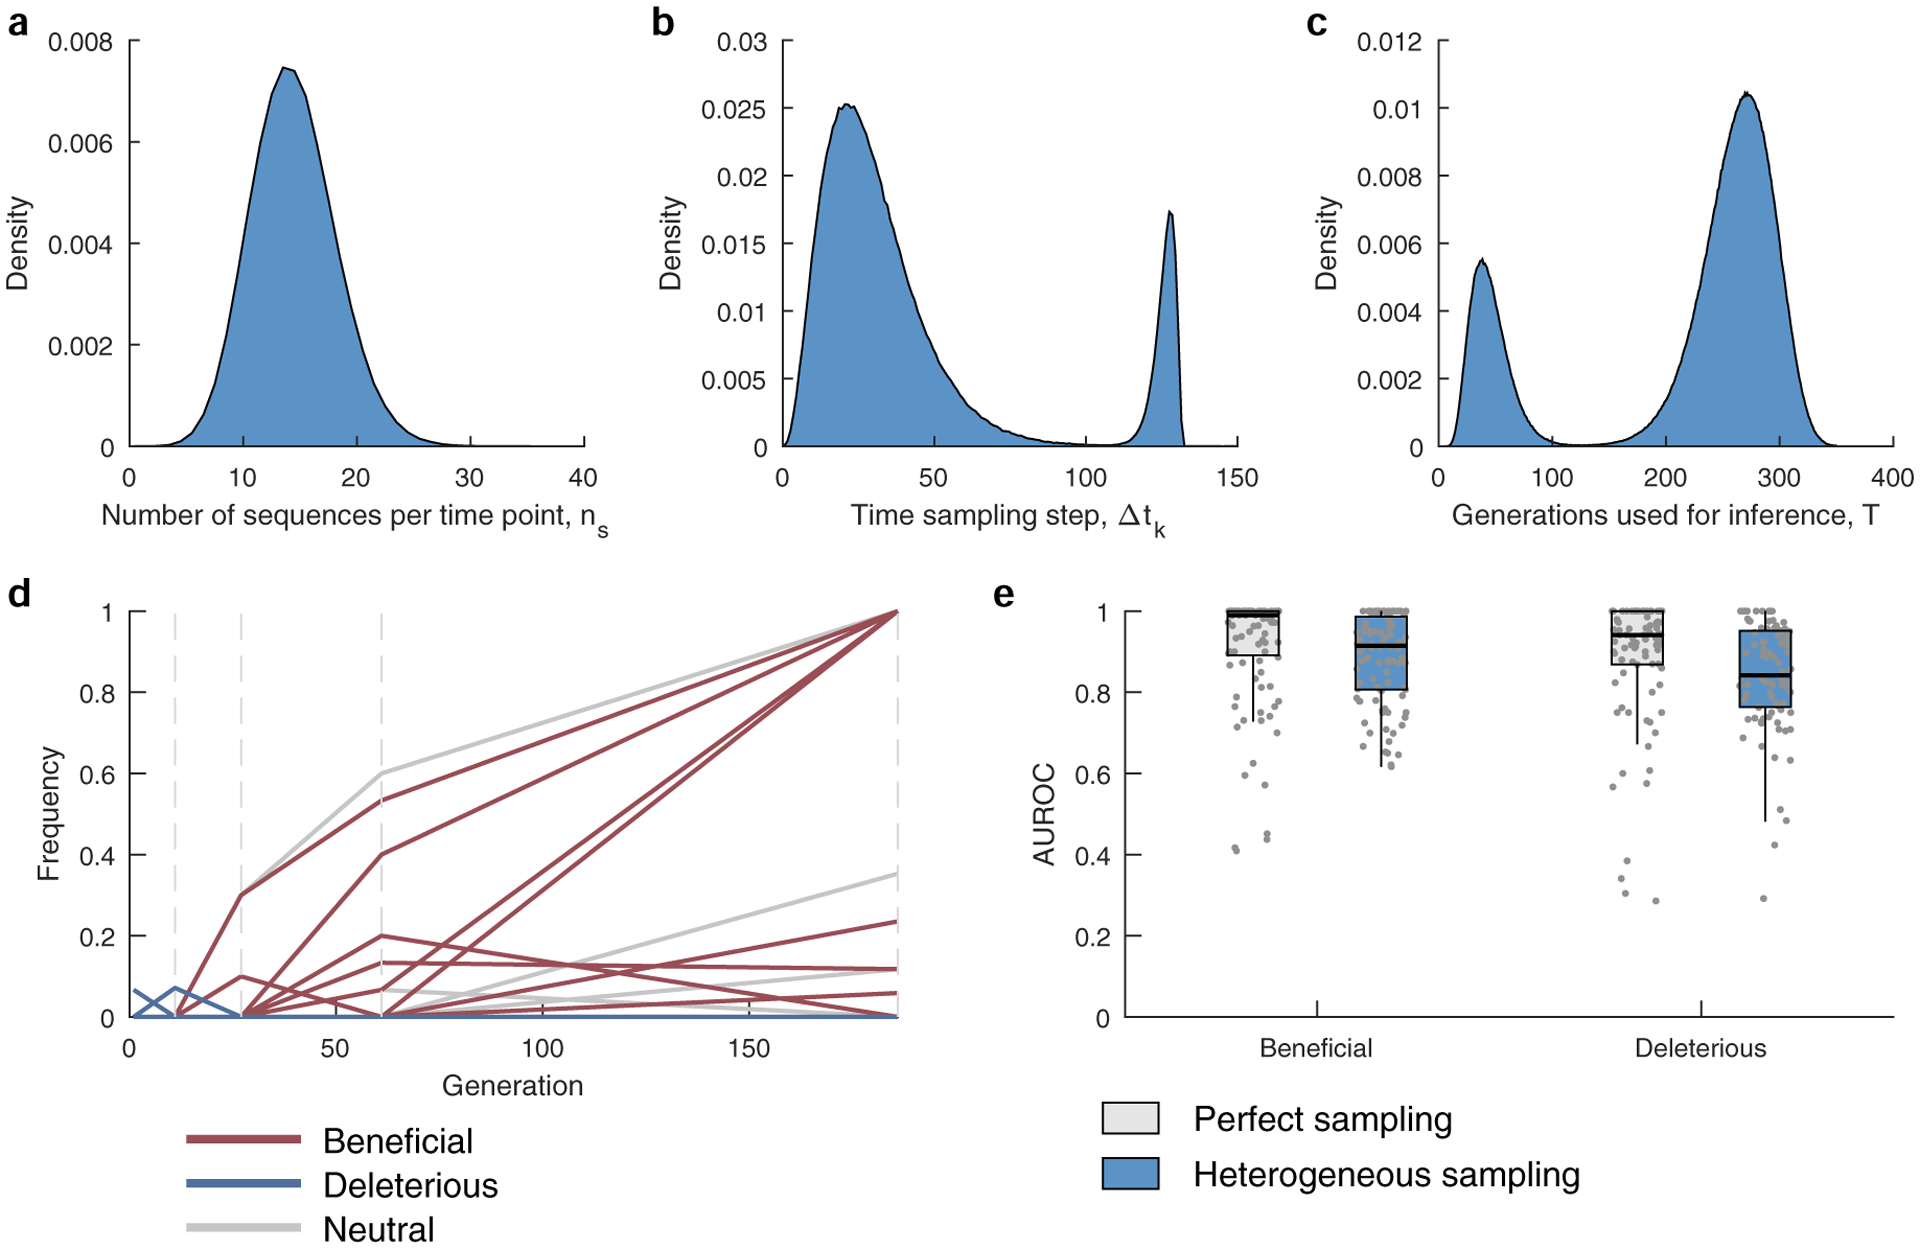
Extended Data Fig. 4 |. Performance of MPL on data with HiV-1-like sampling profiles.

a, The number of sequences per time point ns are drawn from a binomial distribution with n = 1000 and p = 0.0139, with the same mean as that of the HIV data. b, The time between samples is drawn from a mixture of two gamma distributions f(x;k,θ), where k and θ are the shape and scale parameters. The mixture distribution has the form w1 × (f(x;k1,θ1) + m1) + w2 × (f((k2θ2 + m2 − x);k2,θ2) + m2) where m1 = 0, m2 = 120, are constants added to shift the mean, k1 = 3.5, k2 = 3, θ1 = 8.4, θ2 = 2, while w1 = 0.87, and w2 = 0.13 are the mixing weights. The parameters were chosen to mimic the distribution of the time between samples of the HIV data analyzed in the manuscript (Supplementary Table 1). c, The number of generations used for inference is also drawn from a mixture of two gamma distributions, having the form given above and with parameters k1 = 5.5, k2 = 15, θ1 = 7.2, θ2 = 8, m1 = 5, m2 = 143, w1 = 0.21, and w2 = 0.79. The parameters were chosen to mimic the distribution of the trajectory lengths of the HIV data analyzed in the manuscript (Supplementary Table 1). d, A typical sampled trajectory of allele frequencies: beneficial (red), deleterious (blue) and neutral (gray). Dashed lines indicate the sampling time-points. e, The AUROC performance of identifying beneficial and deleterious selection coefficients under perfect and heterogeneous sampling scenarios. Results are evaluated for those sites that are polymorphic in the heterogeneous sampling case. Results are shown for n = 100 independent Monte-Carlo runs. The lower and upper edge of the boxplot correspond to the 25th to 75th percentiles, the bar corresponds to the median while the top and bottom whiskers show the maximum and minimum value within 1.5× the interquartile range from the boxplot. Simulation parameters: population size N = 1000, L = 50 loci with two alleles at each locus (mutant and WT), ten beneficial mutants with selection coefficients s uniformly distributed over the range [0.075, 0.125], 30 neutral mutants with s = 0, and ten deleterious mutants with selection coefficients uniformly distributed over the range [−0.125, −0.075], mutation probability per site per generation μ = 10−4, and recombination probability per site per generation r = 10−4.
